

Confused users don't raise their hand.
They churn.
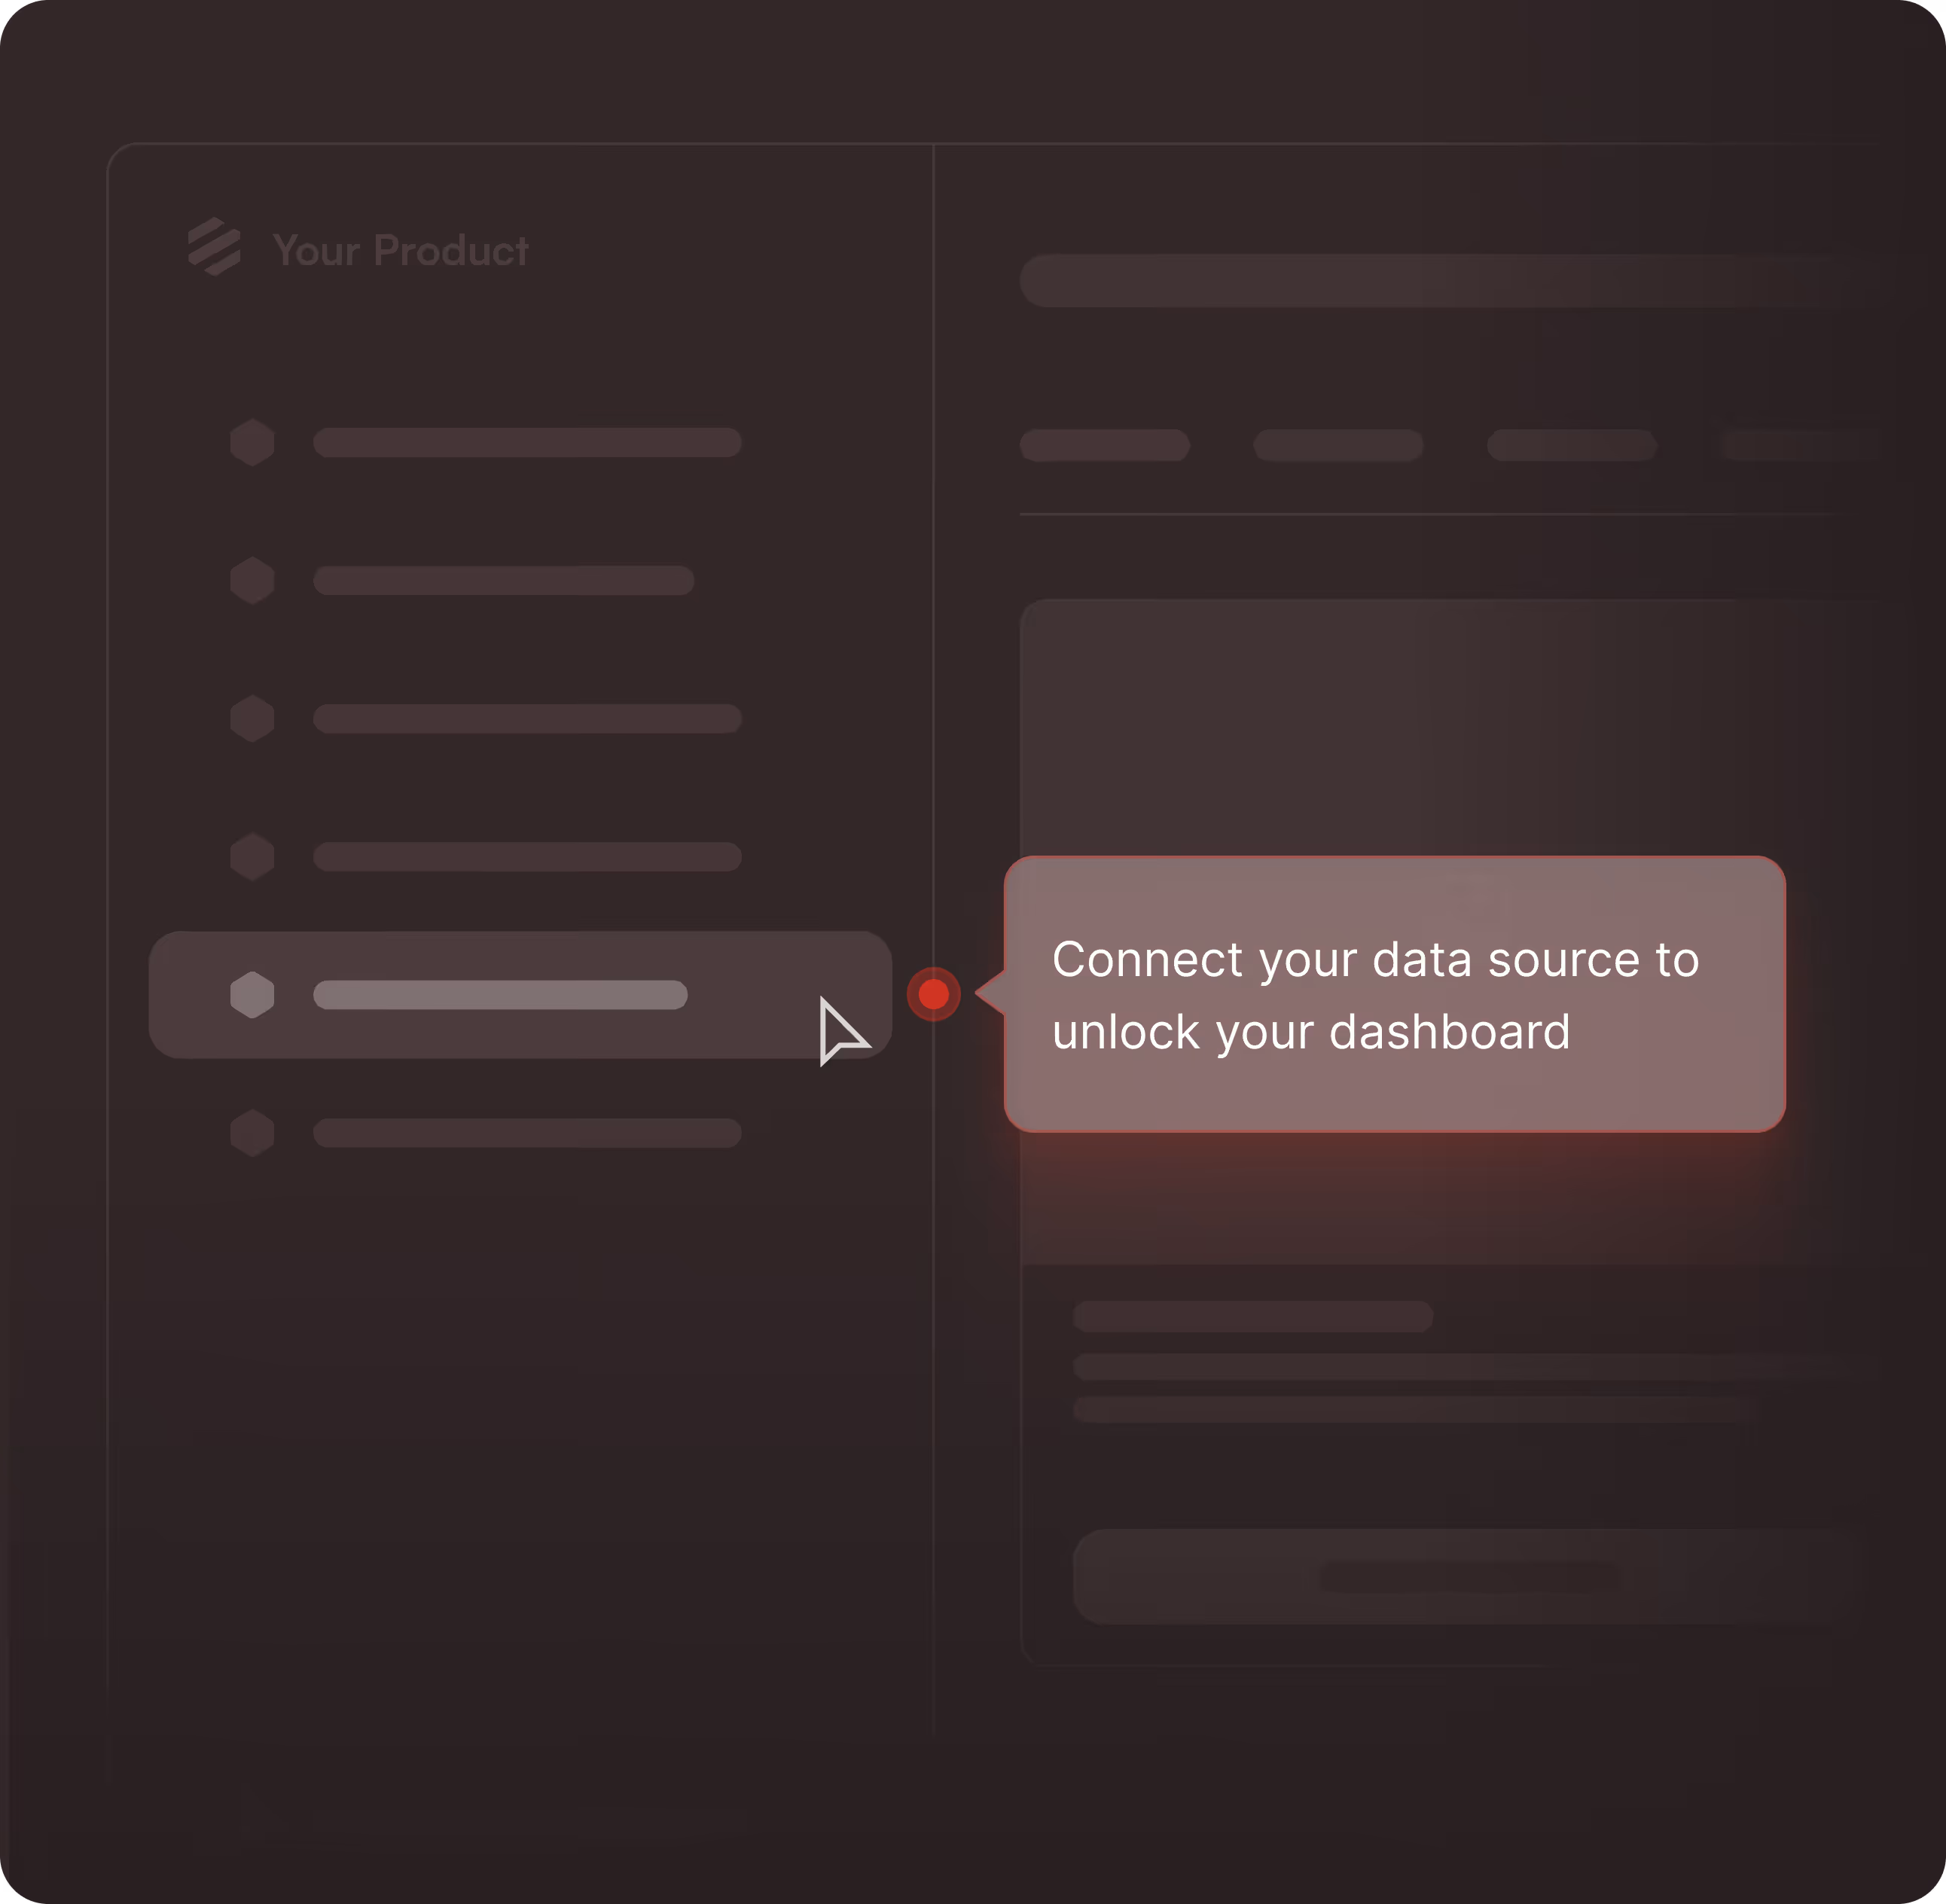
Every unclear feature or mislabeled button is a hesitation moment. And most users won't ask for help. In-app tooltips answer the question before it slows them down.
Users hit unclear UI moments daily
They give up instead of asking
New features ship invisibly and adoption stalls
Your roadmap goes to waste
Documentation lives outside your product
Nobody reads it when they need it
Top brands rely on us to
clear up confusion in-app


Hints and tooltips are just the start of
of real product adoption
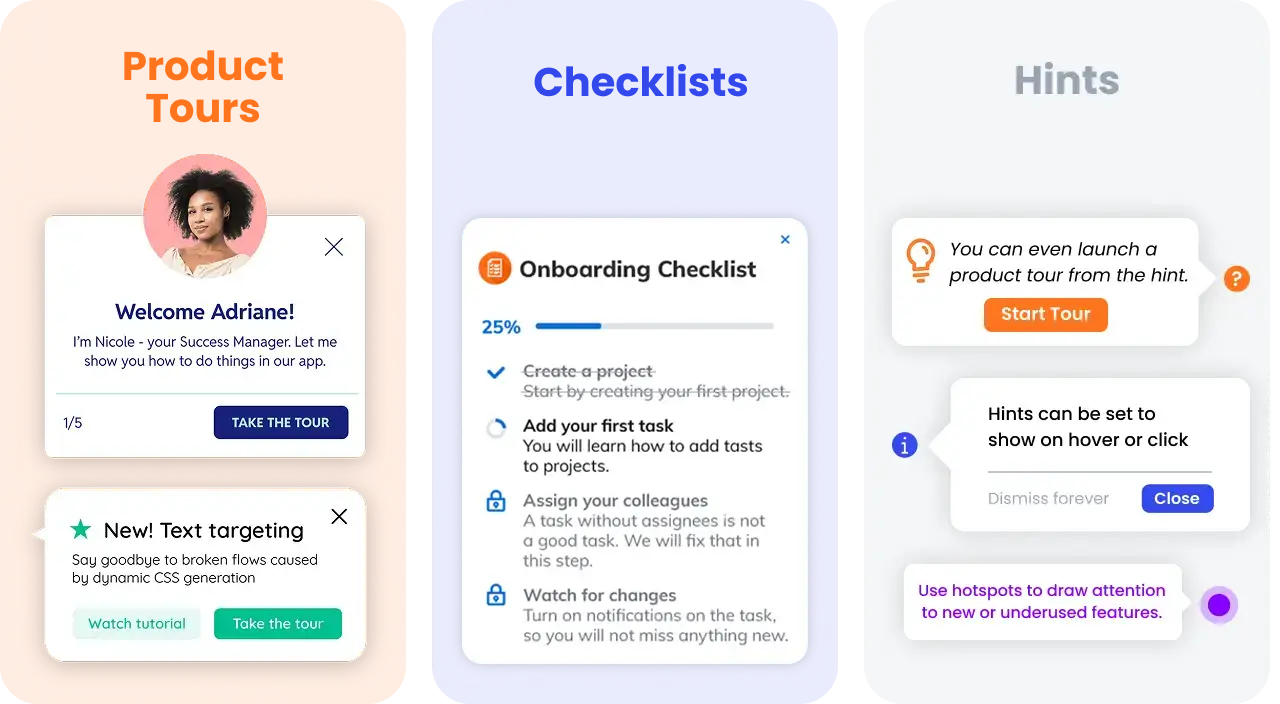
Seamless onboarding
Your product is amazing. Make sure your customers feel it right away.
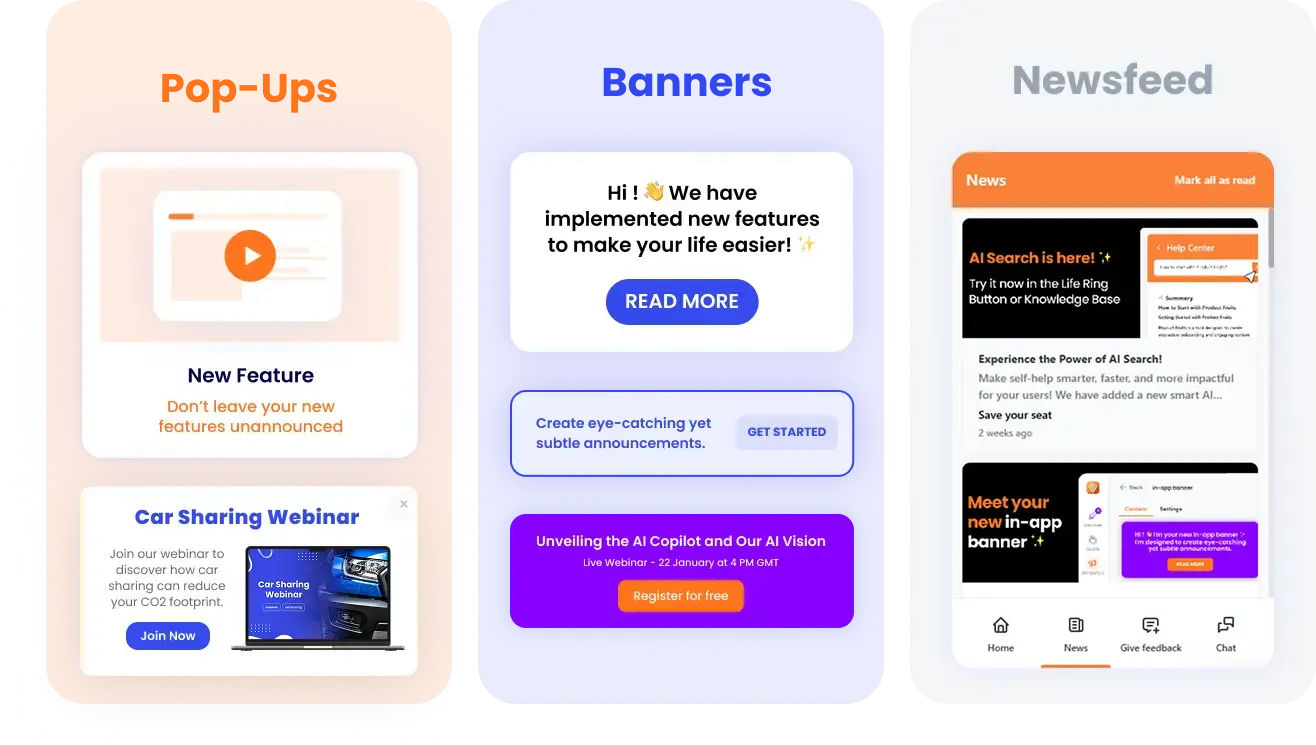
In-product engagement
You have so much to share. Let your users hear it loud and clear.
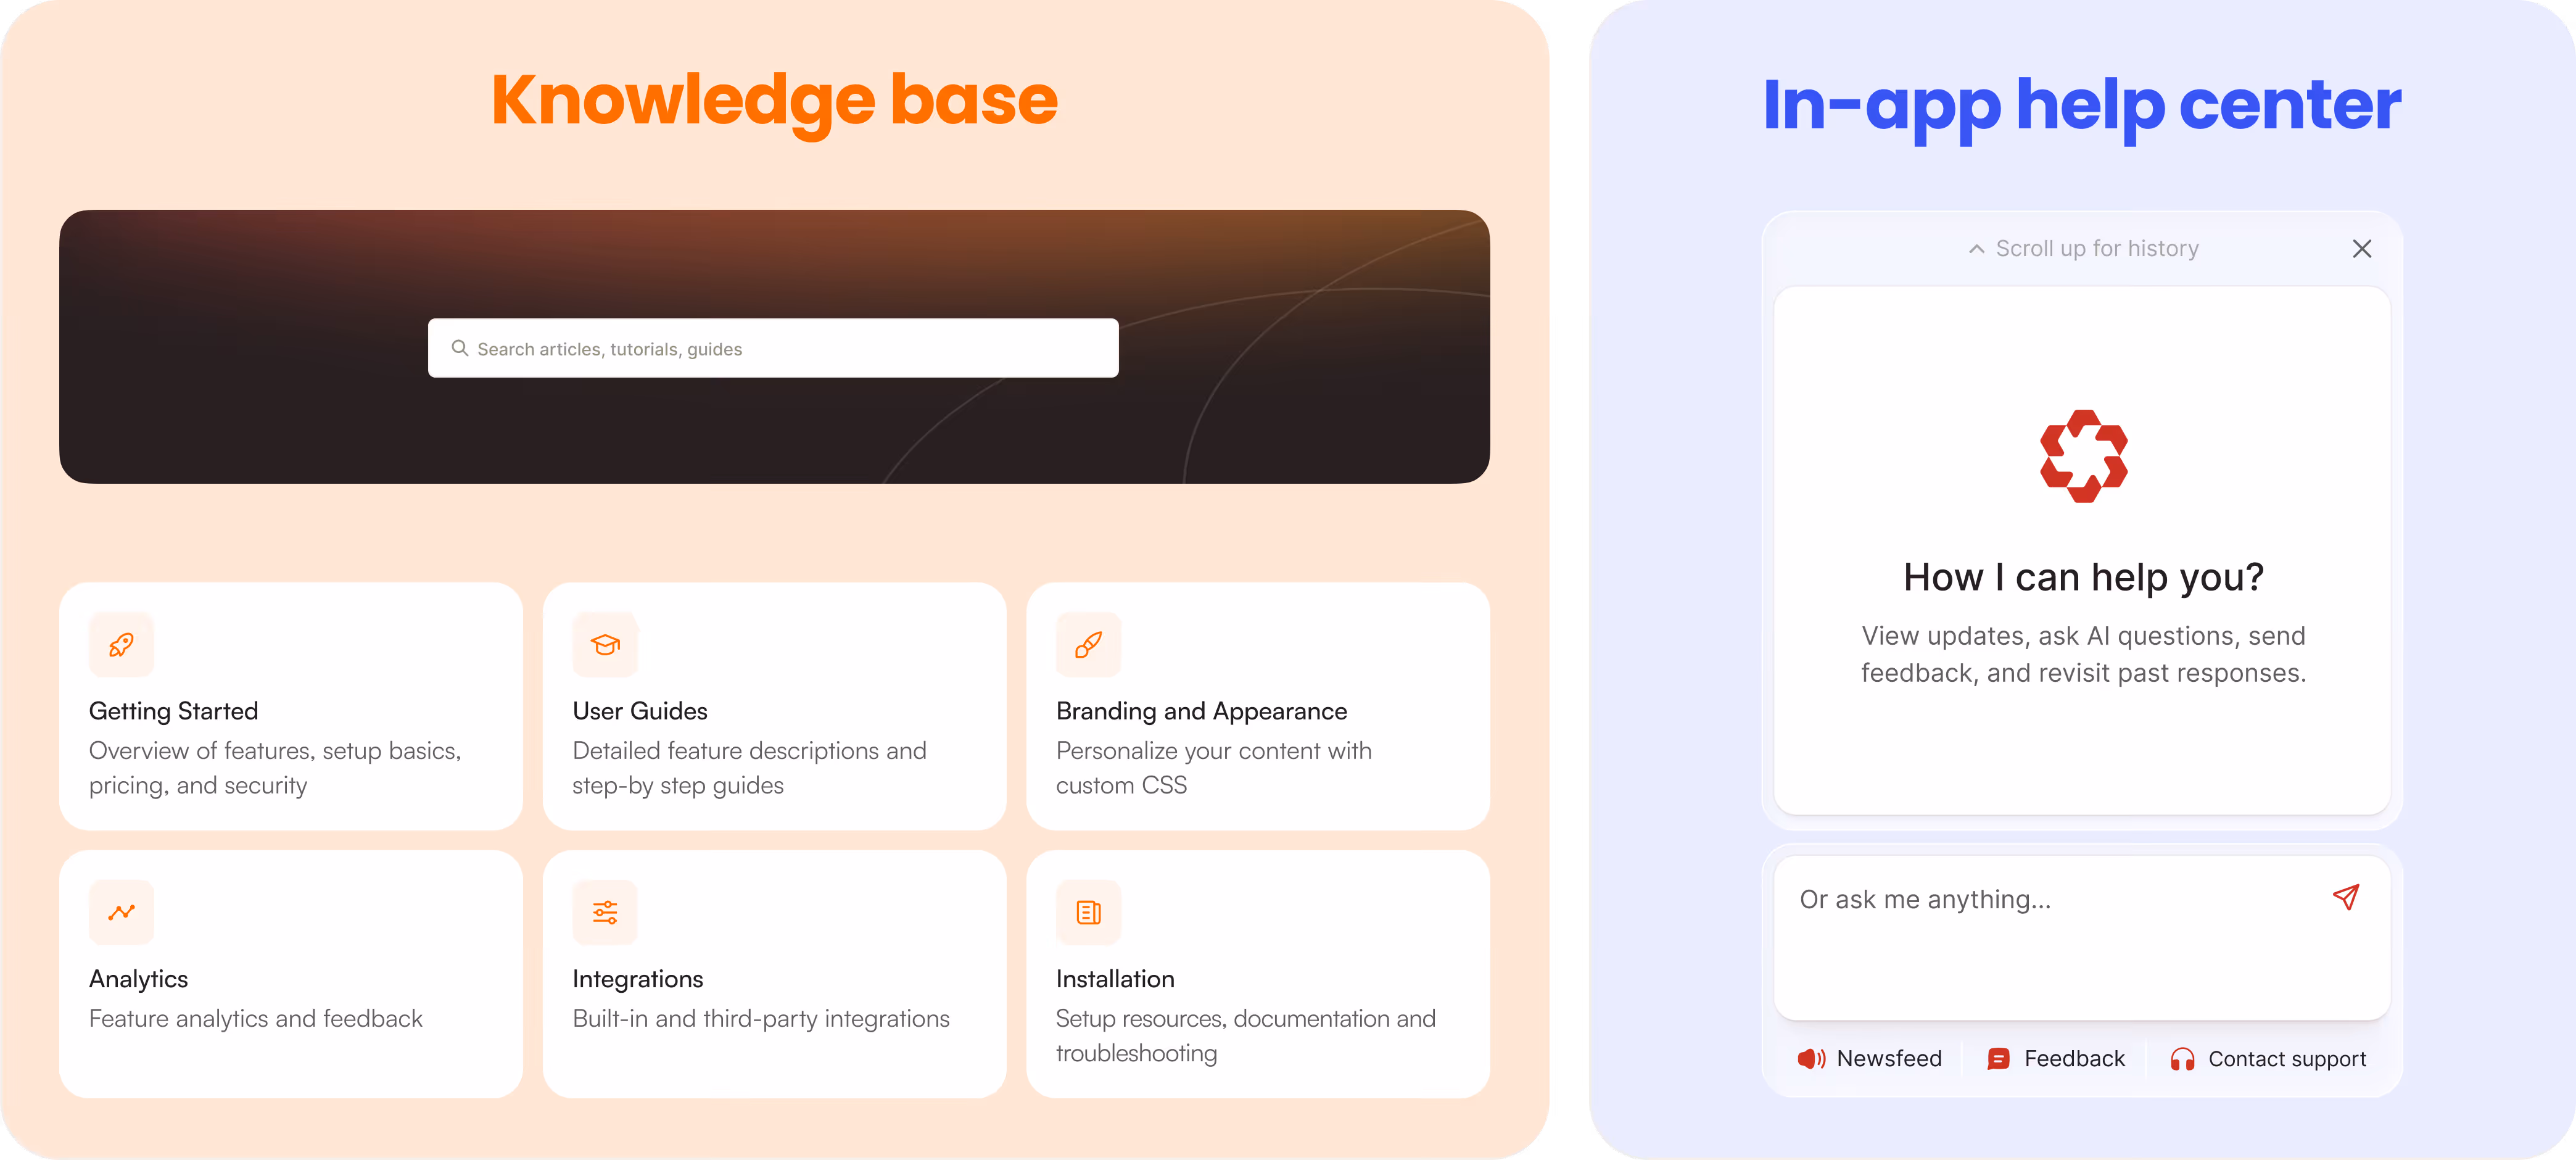
Self-serve support
Help your users when they need it most. Right in your product. 24/7.
Where AI does the heavy lifting
Building in-app guidance shouldn't be your full-time job. Here is what Elvin (our built-in AI) takes off your plate so you can launch in minutes instead of weeks.
Hints and tours that build themselves
Stop dragging and dropping boxes around a screen. Tell Elvin AI what you want to show and it builds your tour or hint in few minutes.
Announcements without writer's block
Launch new features without the "what do I say?" panic. Elvin AI creates beautiful banners and pop-ups so you can hit send and focus on building what's next.
Surveys that actually get answers
Tell Elvin AI what you need to learn (e.g. why trial users are churning), and it drafts the perfect survey. You get the insights without overthinking the setup or the phrasing.
The support agent that never sleeps
Stop making your users hunt for help every time they get stuck. Elvin copilot draws on your knowledge base to answer user questions 24/7.
Proof you can actually show your boss
Don't guess if your in-product guidance works. Our built-in analytics reveal exactly where users stall and where they hit their milestones.
Metrics
Onboarding tour
Select the tour you want to analyze
Onboarding tour
Daily
7d
30d
60d
90d
Custom
Eligible Users
1,748
+23.9%
from previous period
Total number of users eligible to see the tour
Views
1,657
+34.1%
from previous period
Number of unique users who viewed the tour
Finished
72.9%
+23.9%
from previous period
1,208 from 1,657
Percentage of users who completed the tour
Issues
0
Total number and percentage of technical issues in the tour
Skipped
27.1%
-16.9%
from previous period
449 from 1657
Total number and percentage of users who exited the tour early
Average Time to Finish
7m 5s
-57.3%
from previous period
Average time for a user to complete the entire tour
Eligible Users
7,520
+5.8%
from previous period
Total number of users eligible to see the tour
Views
6,970
+28.6%
from previous period
Number of unique users who viewed the tour
Finished
74.3%
+18.2%
from previous period
5,177 from 6,970
Percentage of users who completed the tour
Issues
0
Total number and percentage of technical issues in the tour
Skipped
25.7%
-11.7%
from previous period
1,793 from 6,970
Total number and percentage of users who exited the tour early
Average Time to Finish
7m 48s
-44.2%
from previous period
Average time for a user to complete the entire tour
Eligible Users
14,860
+9.2%
from previous period
Total number of users eligible to see the tour
Views
13,940
+31.4%
from previous period
Number of unique users who viewed the tour
Finished
73.6%
+20.5%
from previous period
10,259 from 13,940
Percentage of users who completed the tour
Issues
0
Total number and percentage of technical issues in the tour
Skipped
26.4%
-12.4%
from previous period
3,681 from 13,940
Total number and percentage of users who exited the tour early
Average Time to Finish
7m 21s
-51.9%
from previous period
Average time for a user to complete the entire tour
Eligible Users
22,230
+7.7%
from previous period
Total number of users eligible to see the tour
Views
20,910
+26.3%
from previous period
Number of unique users who viewed the tour
Finished
72.4%
+26.3%
from previous period
5,157 from 20,910
Percentage of users who completed the tour
Issues
0
Total number and percentage of technical issues in the tour
Skipped
27.6%
-9.8%
from previous period
5,753 from 20,910
Total number and percentage of users who exited the tour early
Average Time to Finish
6m 58s
-55.1%
from previous period
Average time for a user to complete the entire tour
Evidence from the reality of product growth
Forget the marketing deck. Here is what actually happens when you plug Product Fruits into your app.


Trusted by over 1,300+ companies
Without Product Fruits
25%

With Product Fruits
64%
