How to calculate Net Promoter Score (NPS): formula, examples, and benchmarks



TL;DR: Net Promoter Score (NPS) measures customer loyalty with one question: "How likely are you to recommend us to a friend or colleague?" (0–10). The formula is NPS = % Promoters − % Detractors. Score 9–10 = Promoters, 7–8 = Passives (ignored), 0–6 = Detractors. Example: 50% Promoters − 20% Detractors = an NPS of +30. The score runs from −100 to +100, and the SaaS average is around +36.
When I'm about to buy something, I check reviews or ask people I trust (OK, I admit, I often start my research with LLM these days, but people and reviews come next). SaaS buyers do the same, and word-of-mouth is still one of the most powerful growth channels a product has. The catch is that people only recommend products they actually like, so before you can grow through referrals, you need to know how your customers feel.
That's what Net Promoter Score does. It turns loyalty into a single number you can track over time, benchmark against your industry, and tie back to churn and revenue. The problem is that "calculate NPS" sounds more complicated than it is, and a lot of guides bury the formula under theory.
This guide fixes that. You'll get the exact NPS formula, a worked example you can copy, three ways to run the calculation, current benchmarks, and a way to automate the whole thing inside your product.
What is Net Promoter Score (NPS)?
Net Promoter Score is a customer-experience metric that measures loyalty based on how likely customers are to recommend you. It comes from a single survey question rated 0 to 10, and it was created by Fred Reichheld with Bain & Company, introduced in the Harvard Business Review in 2003.
Based on the rating, every respondent falls into one of three groups. Promoters (9–10) are loyal enthusiasts who fuel referrals. Passives (7–8) are satisfied but unenthusiastic, and they're easily tempted away by a competitor. Detractors (0–6) are unhappy customers who can slow your growth through negative word-of-mouth.
NPS matters because a single, comparable number is easy to act on. You can track it quarter over quarter, compare it to competitors, and use the follow-up comments to shape your roadmap. According to the CustomerGauge SaaS NPS Benchmarks report, the average score for the SaaS industry is +36, with the highest performers reaching 92.
"No business can scale past a certain point without tracking customer satisfaction. We track NPS every quarter to measure progress on both product and service. Feedback from detractors shapes the roadmap, and promoters help us double down on what's working." – Kate Perzynska, Content & SEO Lead, Product Fruits
The NPS formula
The NPS formula subtracts the percentage of detractors from the percentage of promoters. Passives are left out of the math entirely – they count toward your total responses but not toward the score.
NPS = % Promoters − % Detractors
Promoters (9–10) − Detractors (0–6). Passives (7–8) are excluded. The result is a whole number from −100 to +100.
A positive score means you have more promoters than detractors, which points to healthy loyalty. A score of exactly 0 means promoters and detractors cancel out, and a negative score means detractors outnumber promoters. Because the range spans −100 to +100, per Qualtrics, the same score can look very different across industries – which is why benchmarks matter (more on that below).
How to calculate NPS step by step
Calculating NPS takes four steps, and you don't need to be a math person to do it.
Step 1 – Ask the NPS question
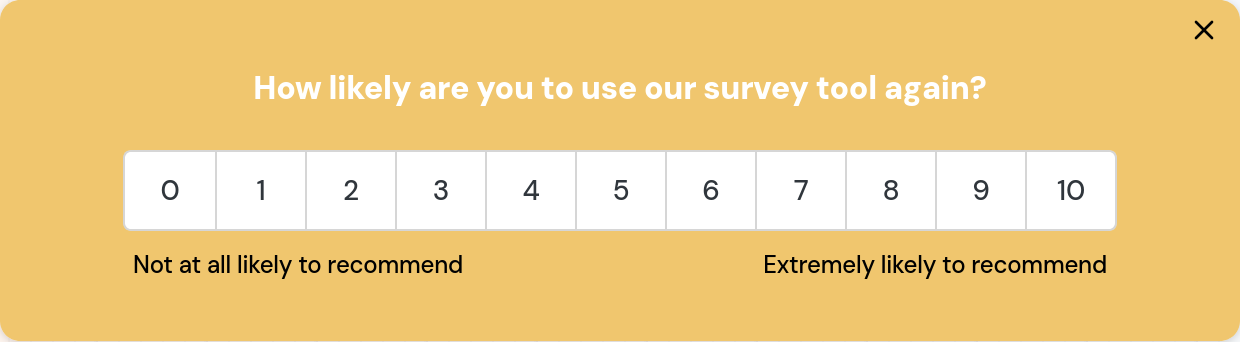
"On a scale of 0–10, how likely are you to recommend us to a friend or colleague?"
Step 2 – Sort responses into three groups.
Promoters (9–10), Passives (7–8), and Detractors (0–6).
Step 3 – Turn each group into a percentage.
Divide the number in each group by your total responses, then multiply by 100.
Step 4 – Apply the formula.
Subtract the detractor percentage from the promoter percentage.
Here's a worked example. Say you surveyed 100 customers and got these results:
Now plug the percentages into the formula: 50% Promoters − 20% Detractors = an NPS of +30. Notice the 30 passives never enter the calculation – they only affect the totals used to work out each percentage.
Promoters, passives, and detractors: what to do with each
Knowing the score is step one. The value comes from acting on each group.
Promoters are your growth engine. Thank them, ask for referrals, reviews, and testimonials, and invite them to test new features. Small gestures turn happy users into active advocates.
Passives are satisfied but not loyal, and they rarely spread the word. Ask what would move them to a 9 or 10, then close that specific gap. Converting passives is often the fastest way to lift your overall score.
Detractors are your churn risk. Follow up quickly, find the root cause, and fix it before they leave. Research consistently shows that a well-handled complaint can win a customer back, so treat every detractor as a save opportunity rather than a lost cause.
3 ways to calculate your NPS
Once you know the formula, there are three practical ways to get to your number.
1. By hand. For a quick read on a small sample, the four steps above are all you need. Count each group, convert to percentages, subtract. It works, but it doesn't scale.
2. In Excel or Google Sheets. Put every 0–10 response in a single column (say A2:A11 for 10 responses), then use COUNTIF to bucket them:
- Promoters:
=COUNTIF(A2:A11,">=9") - Detractors:
=COUNTIF(A2:A11,"<=6") - Total responses:
=COUNTA(A2:A11)
Then calculate the score in one cell: =(COUNTIF(A2:A11,">=9")/COUNTA(A2:A11) - COUNTIF(A2:A11,"<=6")/COUNTA(A2:A11))*100. With 4 promoters and 3 detractors out of 10, that's (0.40 − 0.30) × 100 = an NPS of +10.
3. With an online NPS calculator. Free tools like Qualtrics' NPS calculator let you paste in your promoter and detractor counts and return the score instantly. Handy for a one-off number, but you still have to collect and paste the data yourself.
All three work. None of them collect the responses for you, tie the score to individual users, or track it over time – which is where an in-app survey tool comes in.
What's a good NPS score?
A good NPS depends on your industry, but the general rule from Bain & Company, the creators of the metric, is simple: anything above 0 is good, above 50 is excellent, and above 80 is world-class. For SaaS specifically, the CustomerGauge benchmark puts the industry average at +36, so clearing the mid-30s means you're beating the pack.
The most useful comparison, though, is you against your own past scores. A rising trend line tells you more than any single number.
Relationship vs transactional NPS
There are two ways to run an NPS survey, and they answer different questions. A relationship survey measures overall loyalty to your brand, sent on a regular cadence. A transactional survey measures satisfaction with one specific moment, sent right after it happens.
Most SaaS teams run both: a quarterly relationship survey for the headline number, and transactional surveys after key moments to catch problems early.
How Product Fruits calculates NPS for you
The manual methods above give you a number. Product Fruits gives you the number, the context, and the follow-up – all inside your app, with no spreadsheets to maintain.
You build a customizable in-app NPS survey from a template or from scratch under User feedback > Surveys. NPS is a built-in rating type that uses the standard 0–10 scale, so you don't have to configure the scoring. Add qualitative follow-up questions and use survey branching to route detractors, passives, and promoters to different questions – for example, asking detractors what went wrong and promoters what they loved. You can match the survey to your brand, target it with segmentation, and schedule it to appear at the right moment or on a recurring basis.
The score is calculated for you. In the survey analytics view, NPS results appear as a distribution bar and a graph showing the split of promoters, passives, and detractors, while open-text answers roll up into a word cloud so themes surface fast. You can filter responses by time period and export the raw data to Excel whenever you need it.
Two things make this more than a survey widget. First, NPS surveys can live inside Flows, Product Fruits' branching, behavior-aware experience builder, so a low score can automatically trigger the next step – a help message, a follow-up question, or an alert to your team. Second, the Product Fruits MCP integration lets an AI assistant like Claude read your workspace data over the Model Context Protocol (read-only, via secure sign-in), so you can ask questions about your NPS trends in plain language instead of digging through dashboards.
Frequently asked questions
How many questions should an NPS survey have?
Start with the one question that defines NPS: "How likely are you to recommend us to a friend or colleague?" on a 0–10 scale. Then add one or two follow-ups to explain the score. Keep it short – three to five questions is the sweet spot, since longer surveys lower response rates without adding much insight.
How many respondents do you need for a reliable NPS?
There's no universal number, but aim for at least around 100 responses for a directional read. Larger samples (300–500+) tighten the margin of error and make trends more trustworthy. The right size depends on your total customer base and how confident you need to be, so scale it to your audience.
What follow-up questions should you ask after the NPS score?
Tailor the follow-up to the group. Ask promoters what they love and whether they'd refer you. Ask passives what would earn a higher score. Ask detractors what went wrong and how you could fix it. Branching lets you show each group the right question automatically, which produces far more actionable feedback than one generic box.
Relationship vs transactional NPS: which should you use?
Use relationship NPS for the big picture and transactional NPS for specific moments. Relationship surveys run on a schedule (often quarterly) to track overall loyalty. Transactional surveys fire right after an event like onboarding or a support ticket to measure that experience. Most teams run both.
How often should you run an NPS survey?
For relationship NPS, quarterly is the common cadence – frequent enough to spot trends, infrequent enough to avoid survey fatigue. CustomerGauge recommends quarterly for B2B. Transactional surveys run continuously, triggered by the event they measure. Avoid surveying the same user too often.
Does Product Fruits calculate NPS automatically?
Yes. Product Fruits calculates your NPS from in-app survey responses and shows it as a distribution bar and graph of promoters, passives, and detractors, with open-text feedback summarized in a word cloud. You can filter by time period and export the data, so there's no manual math or spreadsheet upkeep.
The takeaway
NPS isn't just a number – it's a fast, comparable read on customer loyalty that connects directly to churn and growth. The formula is simple (% Promoters − % Detractors), the benchmarks give you context, and the follow-up comments tell you what to fix. The hard part isn't the calculation, it's collecting responses consistently and acting on them.
That's where doing it in-app pays off. Product Fruits runs your NPS survey where your users already are, calculates the score for you, and turns detractor feedback into next steps instead of a static report. Why guess how your customers feel when you can ask them directly, in context, and act on it the same day?
Book a demo or start a 14-day free trial to see how Product Fruits can help you measure and lift your NPS.


Weekly newsletter
Get the latest releases, tips, articles, and exclusive interviews delivered to your inbox weekly—no spam!