Understanding and Measuring Churn Rate


Every successful digital business eventually faces the same question: "How do we keep users from leaving?" Customer churn (or customer attrition) is one of those make-or-break metrics every subscription-based business must grapple with. It tells you, in no uncertain terms, how many customers or users are leaving your product or service over a given period.
For product managers, churn rate is an indispensable checkpoint when deciding how to prioritize new features, refine onboarding, or adjust pricing. Meanwhile, customer success managers rely on it as an early warning system, flagging when user engagement wanes.I
In this churn rate deep dive with 5+1 formulas, we will walk you through the fundamentals of churn rate—from simple ways to calculate it, through historical context, and variations like revenue churn and seat churn to exploring why it matters for everything from profit margins to scalable growth. Along the way, we'll show how platforms like our Product Fruits can give you a head start in reducing churn.
What is the Churn Rate
Churn rate is a key metric that tells you how many customers or users stop using a product or service over a specific period. It is often used as one of the main KPIs in digital subscription models where many users might leave the service (churning) for similar reasons. We have already covered five frequent reasons why users may churn in one of our previous articles.
Churn rate origins
Churn typically exists in any membership or subscription-based business model, especially in cases where customers have other options or alternatives readily available. Subscription-driven sectors like print media (newspapers, magazines), membership services (for example, gyms), and telecom companies understood and studied it even before the digital product or SaaS era.
As explained below, the emergence of mobile networks and software as a service (SaaS) in the early 2000s made the churn rate even more prominent. The subscription-based nature of SaaS and online services—and the relative ease of switching to another provider—made churn an indispensable metric for forecasting revenue and ensuring long-term growth.
While the churn rate is a much more significant challenge for digital product and service providers, there are also much better tools to tackle it - like Product Fruits, which allows you to focus on and improve many churn-related areas from customer or user onboarding through product and feature adoption to AI-enhanced self-help. Try it for free - the first two weeks are on us.
5 + 1 churn rate fomulas
Next to the basic churn rate formula, you may encounter variations and alterations that are either financially oriented or better describe the specific nature of what is being measured. You will find them all below.
#1 Basic Customer Churn Rate
Customer churn rate is often expressed as a percentage. To calculate it, you simply divide the number of customers who leave by the total number of customers at the start of that period.
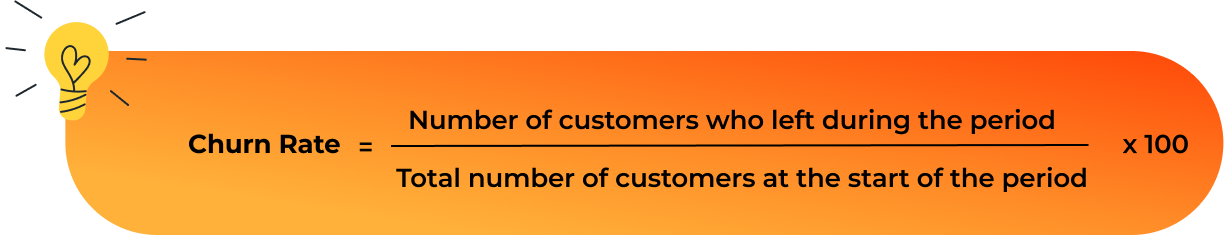
A quick glimpse at the formula will tell you that you do not need a dedicated online churn rate calculator; just launch a system calculator app, divide two numbers, and move the decimal point two places to the left.
Customer Churn rate is mainly used by:
- Product managers to better understand how well the product satisfies user needs and whether the company's offerings meet market demands.
- Customer success managers are a guiding light for retention strategies. Being able to identify when and why users disengage means they can intervene before churn becomes a trend.
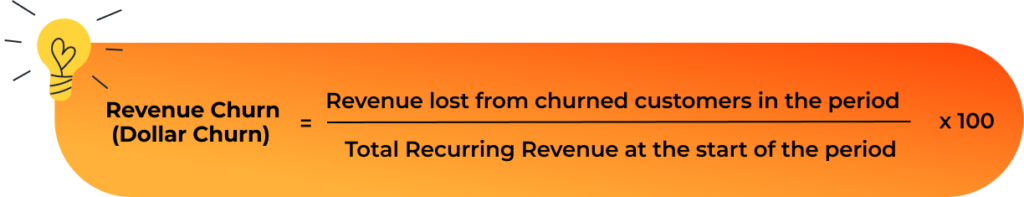
#2 Revenue Churn (Dollar Churn)
How It's Different from Basic Churn Rate:
- Focus on Money vs. Customer Count: Instead of counting the number of customers left, it calculates the amount of recurring revenue (e.g., Monthly Recurring Revenue, or MRR) lost.
- Why It Matters: Losing one high-value customer might have a more significant financial impact than losing several smaller accounts. For product managers, this helps prioritize retention efforts around high-revenue segments. For customer success teams, it underscores the importance of "white-glove" service for your most prominent clients.
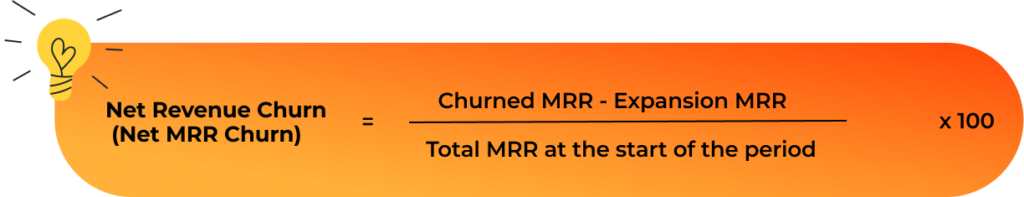
#3 Net Revenue Churn (Net MRR Churn)
How It's Different from Revenue Churn:
- Accounts for Expansion Revenue: This variation subtracts the extra revenue you gain from existing customers, such as upgrades, cross-sells, or seat expansions.
- When to Use It: This is especially relevant in SaaS, where expansion revenue can offset lost revenue. If negative churn appears (meaning expansion revenue surpasses churned revenue), you're effectively growing even if some customers leave.
- Strategic Implication: Allows companies to see the true net impact on recurring revenue, highlighting the role of account growth in mitigating churn.
#4 Logo Churn vs. Seat Churn
How They Differ:
- Logo churn Measures the number of entire customer accounts lost. This metric is about the absolute count of businesses or organizations that stopped being customers.
- Seat Churn: This measure focuses on how many individual user licenses were canceled, even if the overall account remains. For example, a company might remain a client but reduce its user seats from 50 to 30.
- Why These Matter: In B2B SaaS environments (e.g., productivity tools, CRM platforms), a seat reduction is still a partial churn event that hits revenue and/or indicates a drop in usage or value perception.
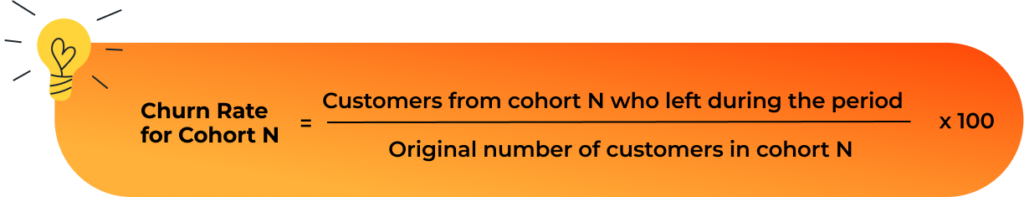
#5 Cohort-Based Churn Analysis
While not a single formula, cohort analysis breaks down churn rates by grouping customers based on their start date (or another shared characteristic) to see how churn evolves. A simplified approach is:
Why It's Useful:
- Longitudinal View: Helps product managers understand if churn is improving or worsening with new product releases or onboarding strategies.
- Targeted Interventions: You can pinpoint which month (or product usage milestone) users are more likely to drop off, allowing for more data-driven retention efforts.
+1 Retention Rate Formula (the Flip Side)
This is technically not churn, but as it is just a reversed view of the same metric, we feel compelled to mention how many users stay rather than leave. The basic retention rate is: Retention Rate=100%−Churn Rate, or in detail:
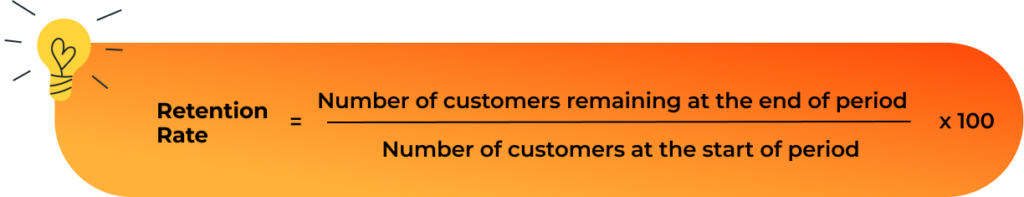
Retention is just positive framing; a more encouraging (or communicable) metric shows how many customers stick around.
Monthly vs. Annual Churn Rate: Why the Distinction Matters
The Cumulative Effect of “Low” Monthly Churn
It’s tempting to dismiss a 1% or 2% monthly churn rate as manageable; after all, a small fraction of your customers leaving each month can feel insignificant in the short term. However, churn is cumulative: losing a small percentage of customers consistently over the year compounds into a much larger overall churn figure.
How to Calculate Annual Churn from Monthly Churn
To find your annual churn rate given a monthly churn rate, you can use the following formula based on compounding losses:

Example: If you have a 2% monthly churn, then your annual churn is ≈ 22%. Even a modest-looking monthly churn adds up to significant annual losses.
Illustrative Table: Monthly vs. Annual Churn
Monthly ChurnAnnual Churn (Approx.)1%1 - (1 - 0.01)^12 ≈ 11%2%1 - (1 - 0.02)^12 ≈ 22%3%1 - (1 - 0.03)^12 ≈ 31%4%1 - (1 - 0.04)^12 ≈ 39%5%1 - (1 - 0.05)^12 ≈ 46%
Note: The above percentages are rounded.
What is a "healthy" average churn rate
Actual churn rates vary widely based on factors such as product maturity, target market, price point, and competitive landscape. However, the average monthly and annual churn rate figures below offer a starting point for assessing how your churn compares to broader industry norms and average churn rate.
B2B SaaS
- Monthly Churn: ~1–2%
- Annual churn: ~10–20%
Why the Range?
- Enterprise-level SaaS companies (serving large organizations) often have lower churn (near 1% monthly or below) due to longer, contract-based engagements.
- SMB-focused SaaS can see higher monthly churn, sometimes 3–5%, because smaller businesses may be more cost-sensitive or prone to frequent vendor changes.
Sources: KeyBanc SaaS Survey, Baremetrics Average SaaS Churn, and ProfitWell Churn Benchmarks.
B2C Subscription Services
- Monthly Churn: ~3–8%
- Annual churn: ~30–50% (cumulative)
Why the Range?
- Streaming Services (e.g., Netflix, Hulu) typically cite average monthly churn rates in the 2–4% range, though this may spike after price increases or major content shifts.
- Note that "physical" subscription-based services (e.g., meal kits and beauty boxes) can experience higher churn, sometimes 8–10%+ monthly, due to the "try-and-cancel" nature of their customer base.
Sources: Parks Associates OTT Churn Rates, Reculry Research Subscription E-commerce
Online Gaming & MMOs
- Monthly Churn: ~5–15% (can vary even more for free-to-play titles)
- Annual Churn: Potentially very high, significantly if the game's popularity drops off quickly.
Why the Range?
- Gaming businesses frequently see spikes in churn after a new release peak or once players reach end-game content.
- Free-to-play (F2P) models can have high initial churn—players may try the game for a few sessions and then stop.
Sources: GameAnalytics, Newzoo
Why churn rate matters: from origins to implications
To better understand churn rate implications for various types of businesses and roles, we will now look closer at why it matters.
An early warning system
Whether you're building a new feature or refining customer onboarding flows, understanding your churn rate serves as an early warning system:
- A high churn rate signals potential product gaps, poor user experience, misaligned pricing, or even ineffective marketing promises that don't match the product's value.
- A low churn rate, on the other hand, suggests strong product-market fit, robust customer loyalty, and effective user engagement strategies.
Historically, companies focused on churn to maximize profit from each customer's lifetime value—especially when acquiring a new customer was more expensive than retaining an existing one. Today, the concept has broadened beyond mere cancellations or expirations. Modern churn analytics can include partial churn (like downgrades) and user disengagement in free or freemium models.
By digging into churn data, product managers can discover which features drive the most adoption and loyalty, while customer success teams can deploy targeted retention campaigns. From early telecom days to modern SaaS subscriptions, tracking churn rates is about protecting and nurturing the most valuable business asset—your customer base.
So, churn rate matters. To reduce customer churn, you should look into user onboarding, create onboarding flows and checklists for new users, or improve self-help with an AI-enhanced knowledge base and other features of user onboarding platforms like Product Fruits. Try it for free - the first two weeks are on us.
Customer retention vs. acquisition costs
It's a well-known axiom in marketing that acquiring a new customer costs more than retaining an existing one. Studies (such as those popularized by Bain & Company and the Harvard Business Review) suggest that acquiring a new customer can be anywhere from 5 to 25 times more expensive than keeping a current customer engaged. It was the comparison of customer acquisition costs and retention costs that initiated advancements in measuring churn rate and related customer satisfaction metrics or KPIs:
- First in telecommunications more than 25 years ago. Unlike landlines, mobile services allow customers to transition to another provider easily. In the late 1990s and early 2000s, companies like AT&T discovered that its customer acquisition efforts, which included large advertising budgets and promotional discounts, produced only short-lived wins if churn remained high. By contrast, investing in loyalty programs and personalized customer support delivered more stable, long-term revenue streams.
- Later, when the SaaS software model started to evolve a decade later, many SaaS startups quickly discovered that they might spend $200–$300 to acquire a single user (covering marketing, sales calls, onboarding) while retaining an existing user and related recurring revenue might simply mean continuous product value delivery—no sizeable upfront customer acquisition cost necessary.
To put it simply, when you retain customers, you help maximize profit margins. The longer a user subscribes, the more you recoup that initial acquisition investment. You can do many things in Product Fruits to improve customer retention—improve feature adoption with tours, announce new features and updates with banners or newsfeeds, and provide advanced in-app help with our Life Ring Button. Try it for free—the first two weeks are on us.
Churn can kill your growth strategy
High churn creates a "leaky bucket" scenario—regardless of how many new customers you bring in, you're perpetually losing a significant portion of them. This frustrates growth projections and can mask the success (or failure) of new product initiatives. While this is not a new discovery in business, marketing, and sales, it has become much more critical in the last 25 years:
- During the Dot-Com Bust (early 2000s), many internet companies rapidly acquired new users (fueled by venture capital) but failed to keep them engaged. With high churn rates, these companies couldn't demonstrate sustainable growth, leading to mass closures or fire sales when funding dried up.
- Online Gaming brought us massive multiplayer online games (MMOs), which can attract millions of players during a new release or expansion. However, if the user base rapidly loses interest—churning out after one or two months—revenues quickly plunge, undermining the viability of future game updates or generating losses from ongoing operations of the necessary servers and online services.
If you work in a startup (or SaaS company), you probably know what MRR or ARR—monthly or annual recurring revenue—is. It is a key metric for many investors and owners. A high churn rate can signal instability in these revenue streams.
However, churn may also be essential and relevant to your product roadmap adjustments. Product managers often need to pivot if they notice churn among users who only partially adopt the product. This can refocus entire development cycles or bring up the need to focus on retention enhancements, that is, improved onboarding flows, better self-help, and other things Product Fruits can help you with. Try it for free - the first two weeks are on us.
CLV/LTV: How Churn Factors in
Customer Lifetime Value (CLV or LTV) quantifies the total revenue you can expect from a single customer over the entire duration of their relationship with your business. Churn rate is a key variable here—customers won't stick around long enough to generate significant lifetime value if churn is high.
A simplified CLV formula often looks like:

Even a tiny uptick in churn can drastically reduce the lifetime value. For example, if your monthly churn rate jumps from 2% to 4%, you effectively halve your customers' average lifetime, dramatically reducing how long they contribute revenue. Or, in more detail:
- SaaS Email Marketing Platform: Suppose an email marketing tool charges $50/month per user. If its churn rate is 2% monthly, the average customer stays roughly 50 months (since the average tenure ≈ is 1 ÷ 0.02). If churn doubles to 4%, the average tenure drops to about 25 months, halving the revenue potential per user.
- Streaming Services: Netflix and Spotify carefully monitor churn because each user subscribing for years provides multiple times their initial acquisition cost. The CLV calculation sharply diminishes if churn spikes due to price increases or content library changes.
With a clear understanding of CLV, you can better decide how much budget to allocate to acquisition channels if you know that each customer is worth $2,000 over their lifetime, spending $400 to acquire them (including marketing, sales, and onboarding) may still be viable—if churn stays stable.
To keep churn stable or to improve it, think about Retention-Focused Initiatives. Companies facing severe churn often redirect significant resources to retention campaigns and customer success staffing. Still, maybe there are smarter ways to tackle churn: Think about implementing a platform like Product Fruits, which is focused both on improving customer onboarding and reducing churn by improving feature adoption, informing users about new functionalities, keeping them more engaged, and providing them AI-augmented self-help. Try it for free - the first two weeks are on us.
Putting It All Together
The churn rate is a bellwether for financial health, growth capacity, and customer value. By tracking churn and analyzing the root causes—be it product gaps, onboarding friction, support issues, low feature adoption, or feature penetration—businesses can make informed decisions that:
- Lower acquisition costs in the long run (through retention-based strategies),
- Support scalable growth (preventing the "leaky bucket" effect), and
- Protect and enhance CLV (ensuring each customer relationship drives meaningful returns).
For product managers, these insights guide roadmap priorities and feature development. For customer success managers, they clarify where to focus user engagement efforts. And for executives, controlling churn is essential for delivering stable, predictable revenue—a foundation for expansion, innovation, and long-term success.


Weekly newsletter
Get the latest releases, tips, articles, and exclusive interviews delivered to your inbox weekly—no spam!