A Guide for Product Managers, Owners, and Customer Success Leaders.
Do you know how many users are actively engaging with your product? How often do they return to use it? What about your customer adoption metrics for yesterday, last week, or last month? Understanding product adoption metrics, particularly the adoption rate, is critical to ensuring the user adoption process is on track.
Knowing the number of new and existing users who have accessed your product or service provides only part of the picture. In today’s digital-first landscape, counting users and measuring usage frequency, customer satisfaction, and how well your product meets user needs is essential. This is where the adoption rate becomes a key indicator.
This article will explore why adoption rate matters, define it, and share practical strategies to improve user adoption rates. We’ll also demonstrate how to effectively measure product adoption rate and use tools like user onboarding and digital adoption platforms (DAPs) to enhance your user onboarding and engagement efforts.
Why adoption rate matters
Adoption rate is more than just a number—it reflects how well your product or service aligns with its target audience’s needs. A high adoption rate indicates that users engage with your product and integrate it into their routines. Conversely, low adoption rates may signal challenges with the onboarding process, usability, or mismatched expectations.
For product adoption leaders, focusing on user adoption strategy is vital for several reasons:
- Revenue Growth: High adoption rates lead to better customer lifetime value (CLV) and retention. Existing customers who find value in your product are more likely to renew, upgrade, and advocate for your service.
- Customer Success: A robust user engagement strategy ensures that your customers achieve their desired outcomes with your product, which increases customer satisfaction.
- Market Position: Products with strong user adoption rates stand out in competitive markets, enhancing your company’s reputation and leadership.
Start increasing your adoption rate right away with Product Fruits. You can try it out for free (two weeks are on us) and start experimenting with onboarding and adoption flows, in-app communication, an integrated help center, and much more!
What is the adoption rate, and who can use it?
The adoption rate measures the percentage of active users compared to the total number of eligible users. This metric is pivotal in understanding whether your user adoption process is successful.
Adoption rate formula

The adoption rate is widely used to measure product adoption for SaaS companies, particularly those focused on the product-led growth (PLG) model, tech startups, and even traditional industries like healthcare and retail. Tools like digital adoption platforms can enhance daily active users (DAUs), monthly active users (MAUs), and overall customer engagement.
Adoption rate in SaaS
Example 1: Duolingo’s Gamified Adoption Strategy
Duolingo’s Gamified Adoption Strategy Duolingo exemplifies a strong user adoption strategy. Gamifying the learning experience with streaks and rewards attracts new users and keeps them engaged, leading to exceptional user adoption rates.
Example 2: Slack seamless onboarding and user-centric design
Slack’s success stems from a clear user onboarding strategy. By simplifying the onboarding process and emphasizing integrations that meet user needs, Slack has achieved widespread product adoption.
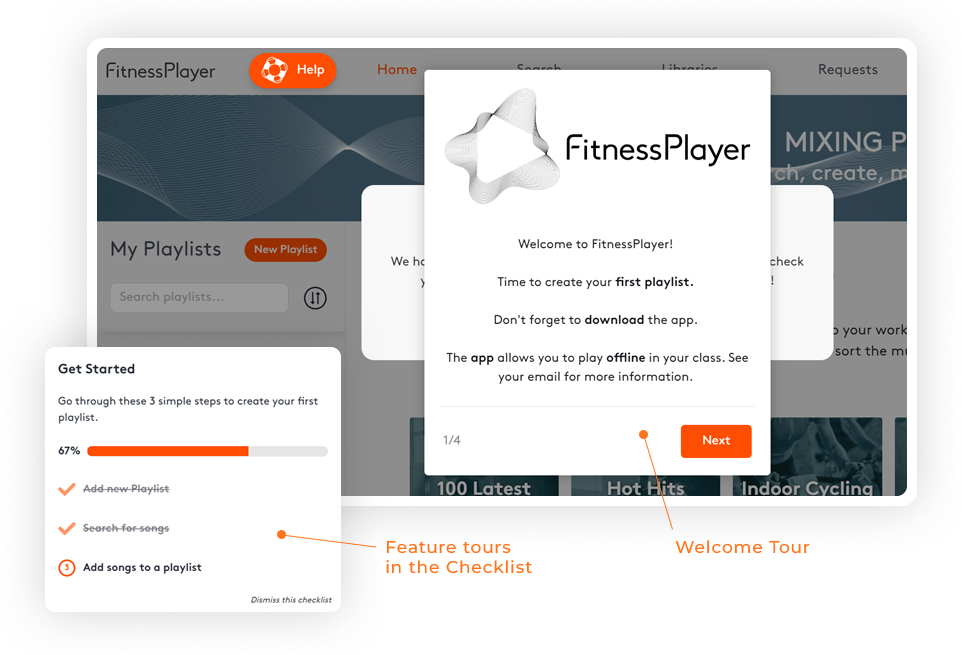
Example 3: FitnessPlayer reduced churn by 70%
Even if you have a complete digital product or web portal that you cannot easily and quickly redesign for better adoption and you do not have the developer capacity to create a sophisticated onboarding process, you can still improve onboarding, retention – and ultimately adoption rate with digital adoption platform like Product Fruits, which works as an invisible layer above your digital product or web portal. Read about FitnessPlayer in the case study and learn how product Fruits works on our product page.
Adoption rate in traditional industries
However, its relevance and digital adoption platforms focusing on improving digital product or service onboarding and adoption extend far beyond the tech world.
Examples:
- Healthcare: Hospitals track adoption rates of digital patient portals to assess engagement and improve healthcare outcomes.
- Education: Schools monitor the use of e-learning platforms to ensure students and teachers benefit from the technology. Read how a renowned university used Product Fruits DAP (digital adoption platform) to onboard students faster.

- Retail: E-commerce platforms measure adoption rates of loyalty apps to boost customer retention.
- Insurance: Insurance companies often use web portals or web apps for their employees and external agents, making measuring their adoption crucial. Read about the Direct Insurance use case, which helped to save 30 training hours monthly and provide 24/7 access to online training and support in our case study.**
By using the adoption rate – ideally, in combination with other approaches mentioned below, organizations can uncover insights into user behavior and make informed decisions about product development and customer engagement strategies.
Using a User Onboarding / Digital Adoption Platform worked for FitnessPlayer and Direct Insurance. You can try it, too, right now, for free, as two weeks are on us. Sign up for Product Fruits now and start improving user adoption!
Measuring adoption rate
To effectively measure the adoption rate, follow these best practices:
- Define “Active Users” Clearly: Customize your product’s definition of active users. For example:
- SaaS: Users log in and complete key actions (e.g., report creation).
- Web Apps: Users access the platform and use core features.
- Portals: Customers performing tasks like making a payment or submitting a request.
- Track Cohorts: Analyze adoption rates over time for specific user groups to identify trends and patterns.
- Use Analytics Tools: Leverage platforms like Google Analytics, Mixpanel, or Amplitude to track user interactions and adoption metrics. You can also use some of the analytics functions of DAP, a digital adoption platform.
- Monitor Key Adoption Events: Identify pivotal moments in the user journey that signify meaningful adoption (e.g., completing onboarding, for example, with an onboarding checklist or using advanced features such as an integrated help center).
Best practices for improving adoption rate
- Streamline Onboarding:
- Provide step-by-step guidance to help users navigate your product quickly; welcome tours and onboarding checklists are great for this.
- Use interactive tutorials, tooltips, and onboarding emails or in-app communication.
- Focus on Value Realization:
- Highlight the benefits of core features early in the user journey – use feature tours and hints.
- Share case studies or testimonials to demonstrate real-world impact. Leverage in-app communication to catch users’ attention at the right time and place—when interacting with your product or portal—and make users aware of new features.
- Collect and Act on Feedback:
- Conduct surveys and usability tests to identify pain points, in-app surveys and feedback are great tool for this.
- Iterate on your product based on collected user insights.
- Engage Consistently:
- Use email campaigns, in-app notifications, or webinars to re-engage existing customers.
- Share feature updates to showcase continuous improvement.
- Simplify the Interface:
- Avoid overwhelming users with too many features at once. Explain more complex, new, or forgotten features with feature tours.
- Use intuitive design principles to enhance usability.
Common mistakes to avoid
- Neglecting User Feedback: Ignoring user concerns and customer feedback can lead to poor customer satisfaction, frustration, and churn.
- Overcomplicating Features: Adding unnecessary complexity discourages adoption.
- Relying Solely on Discounts: While promotions may drive sign-ups, they rarely lead to sustained adoption.
- Measuring Vanity Metrics: Focus on meaningful engagement metrics rather than just sign-ups or downloads. Read our articles on other adoption, user, and product metrics and KPIs.
Start improving your adoption rate right now!
- Set Clear Goals: Define what adoption success looks like for your product. Is it daily logins, completed tasks, or feature usage?
- Analyze Current Adoption: Use analytics to identify your baseline adoption rate and key user segments.
- Prioritize Quick Wins: Focus on areas where small changes can make a big impact (e.g., onboarding flow improvements, increasing usage frequency).
- Collaborate Across Teams: Engage product, marketing, and customer success teams to create a cohesive adoption strategy.
- Iterate and Optimize: Continuously refine your approach based on data and user feedback.
This is the perfect moment to try our digital adoption platform – Product Fruits. Two weeks are on us – free, so just sing up right now!
