Feature Adoption Guide: What Is It & How to Improve It


Have you ever launched a promising feature in your SaaS product only to find that existing users aren’t engaging with it as expected? In today’s fast-paced digital world, feature adoption, a process ensuring your product delivers tangible value, isn’t just important—it’s essential. If a large number of users don’t adopt your product's features, you risk losing out on growth, retention, and your customers' trust.
Why that happens? In real life, many users sign up for a product but fail to embrace all it offers. This can stem from:
- poor feature visibility
- lack of guidance
- unclear benefits.
That is why you need to track and measure whether your active users are aware of particular existing or new features, what percentage have tried them, and how many are using them regularly. When you have such figures, you can then consider the best ways to drive feature adoption.
Feature adoption strategies focus on increasing the number of users aware of, engaging with, and integrating your product’s features into their daily workflows. They go beyond onboarding to ensure that customers fully understand and experience your product's value. When users adopt your features effectively, they find more value, stay longer, and become advocates for your brand.
Understanding how to measure and improve adoption is, therefore, vital.
What will we cover
In this article, we’ll examine key feature adoption metrics and KPIs to track, explore the concept of the feature adoption funnel, and share actionable tips to improve adoption with in-app communication, feature tours, user feedback, and other functions of onboarding and digital adoption tools or platforms. Whether you’re a product manager or a founder, this guide will help you create a product experience that drives engagement, loyalty, and long-term success.
This can be easily achieved with a user onboarding tool or product adoption platform (sometimes also called a digital adoption platform—DAP), such as Product Fruits. The final part of this article describes how functionalities like feature tours, integrated help centers, or in-app communication can be used for feature adoption measures.
Hey, you can try to improve feature adoption by building in-app communication, feature tours, and more right away at Product Fruits! It works as an extra invisible layer over your web app or SaaS - no coding is needed. Try it out now, and the first two weeks are on us!
Metrics and KPIs for Measuring Feature Adoption
Several feature adoption metrics and KPIs provide insight into how many users interact with product features, identify areas for improvement, and develop strategies to boost adoption rates.
While some of the KPIs or metrics mentioned below may, to some extent, overlap with some stages of the feature adoption funnel model and approach (discussed in the second part of this article), they also provide additional perspectives on user behavior.
Understanding these metrics enables teams to make data-driven decisions, implement feature adoption tools, optimize user experiences, and ensure that features meet user needs. Below, we explore five frequently used KPIs:
- Feature adoption rate
- Breadth of Adoption
- Depth of Adoption
- Time to Adopt
- Duration of Adoption
Feature Adoption Rate
Adoption rate is one of the main KPIs or metrics used in the product domain—you can read about it in a dedicated article. Nevertheless, it should also be mentioned in relation to individual features.
Feature adoption rate is a key indicator that tracks the percentage of users who adopt a specific feature within a given timeframe. You can think of it as one metric spanning the entire feature adoption funnel (as discussed below). This metric thus provides a high-level view of how effectively a feature is being integrated into users’ workflows and can highlight the success of marketing, onboarding, and product strategies. Monitoring feature adoption rate helps product teams assess a feature's overall impact and identify areas for improvement.
A high feature adoption rate indicates that a feature is resonating with users and meeting their needs. In contrast, a low adoption rate suggests barriers such as poor visibility, unclear value, or usability issues. By tracking adoption rates over time, teams can evaluate the effectiveness of interventions like feature announcements, in-app guides, and usability improvements.
Feature adoption rate formula

Example: If 500 users out of 2,000 who were notified about a feature started using it, the feature adoption rate would be (500/2000)×100 = 25%
How to Use Feature Adoption Rate
- Track trends over time: Measure feature adoption rates at different intervals (e.g., weekly, monthly) to identify whether the feature is gaining traction or requires further optimization.
- Segment and target users: Consider breaking down the feature adoption rate by user segments (e.g., by plan type, geography, or role) to uncover which groups are adopting the feature and which may need additional support.
- Correlate with other metrics: Track feature adoption rates alongside metrics like Breadth and Depth of Adoption to understand not just how many users are adopting the feature but how they’re using it.
- Iterate and improve: If feature adoption rates are low, revisit strategies like feature promotion, onboarding flows, or even feature design to remove barriers and boost engagement.
Breadth of adoption
The breadth of Adoption measures the percentage of users who have engaged with a specific feature within a given timeframe - it is therefore similar to the “activation” discussed above. This metric provides insight into the feature's reach among the user base. For instance, if 3,000 out of 6,000 customers used a new sharing feature at least four times in a week, the Breadth of Adoption would be 50%. Monitoring this KPI helps identify which features are popular and where you need to encourage new feature adoption through additional promotion or other refinement.
Breadth of Adoption formula:
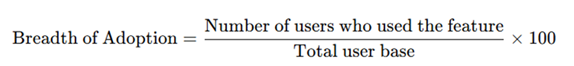
Example: If 2,000 users out of 5,000 have used a feature, the breadth of adoption is: (2000/5000)×100 = 40%
Depth of Adoption
Depth of Adoption assesses how frequently users engage with a particular feature. It reflects the feature's stickiness and relevance to users' workflows. In this, it is similar to “repeated usage” discussed above. Still, it can provide more details - depending on what and how you will include in the measurement - for example, if you can measure per-user usage for a specific timeframe, you can create more detailed reports. A low Depth of Adoption may indicate that the feature does not meet user expectations or is difficult to use. By analyzing this metric, product teams can determine whether a feature effectively addresses user needs and make necessary adjustments to enhance its utility.
Depth of Adoption basic formula:
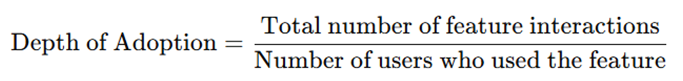
Example: If 1,000 users interact with a feature 5,000 times in a week, the Depth of Adoption is 5000/1000 = 5 interactions per user on average.
Time to Adopt
Time to Adopt measures the duration it takes users to start using a feature after becoming aware of it. This metric highlights potential friction points in the user journey. For example, if users take weeks from discovering to activating and/or regularly using the feature, it may suggest users are struggling to understand the feature's benefits or its complexity. Reducing the Time to Adopt—for example, with a dedicated feature tour—can lead to a quicker realization of value, thereby improving overall user satisfaction.
Time to Adopt formula/process:
To measure the time to adopt, you need to:
- track timestamp of exposure (release and announcement - for example, via in-app comms)
- and timestamp of first or repeated (second, third…) use.
Then calculate:

Example: If users take an average of 3 days to try a new feature, the Time to Adopt is 3 days.
Duration of Adoption (Feature Stickiness)
The duration of Adoption indicates how long users continue to engage with a feature after initial use. A high Duration signifies the feature's sustained value, leading to ongoing usage. Conversely, a low duration may indicate a lack of long-term relevance or satisfaction. By tracking this KPI, product managers can identify features contributing to user retention and those needing enhancement to maintain user interest.
Duration of Adoption formula

Example: Track user engagement patterns post-activation. If most users consistently engage with a feature for 4 weeks after its first use, the Duration of Adoption is 4 weeks.
By systematically monitoring these metrics, your SaaS product team can gain an understanding of feature performance, enabling them to make informed decisions that drive user engagement and product success. So, let's take a look at what those might be.
Hey, you can try to improve feature adoption by building in-app communication, feature tours, and more right away at Product Fruits! It works as an extra invisible layer over your web app or SaaS - no coding is needed. Try it out now, and the first two weeks are on us!
The Feature Adoption Funnel Model
The feature adoption funnel is a framework that outlines the stages users go through from first encountering a feature to becoming regular users. It was concieved by ProjectBI, a company specializing in product analytics.
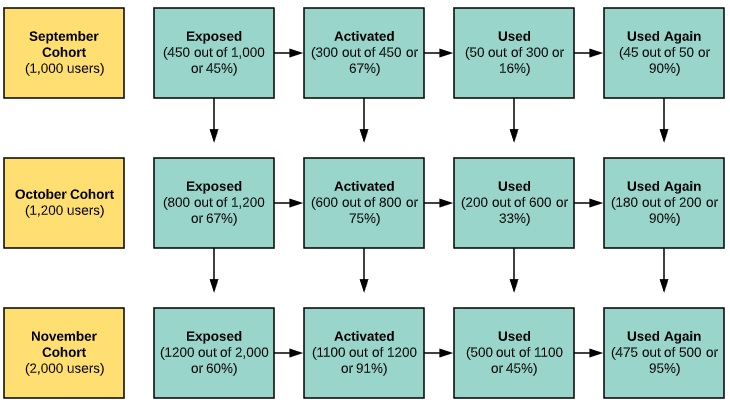
For product managers and their teams, understanding this funnel is crucial for identifying where users may drop off and implementing strategies to enhance engagement and retention. By analyzing the percentage of users from a particular cohort (for example, users who signed up or started working with the product in a specific month) reaching each phase, teams can optimize the user journey, ensuring more users reach further sections of the funnel and thus realize the full benefit from given product feature or groups of features.
1. Exposure
In the exposure phase, users become aware of a feature's existence. This awareness can stem from various channels, including in-app notifications, email announcements, or social media promotions. The first step toward adoption is informing users about new or existing features. Without exposure, even the most valuable features may go unnoticed. The funnel model moves users through the four stages of adoption (Exposed > Activated > Used > Used Again). The goal is to achieve healthy (high) feature adoption rates across the board.
2. Activation
Once users know a feature, the next step is activation—where they try it for the first time. This phase facilitates that initial interaction and demonstrates the feature's value. Effective onboarding, interactive tutorials, feature tours, or guided walkthroughs can encourage users to take this step. You have almost certainly experienced this as a user of some saas or digital product. Trying a feature for the first time results, in some cases, in the so-called “aha moment” when users discover much greater or deeper value in a product - and this is crucial for retention or even upselling.
3. Usage
Trying a new or unknown feature is one thing; using it repeatedly is another. That is why, after activation, product managers and their teams need to focus on the usage phase - users engaging with the feature beyond the initial trial. This stage is critical for understanding whether users find the feature beneficial. Providing contextual help, showcasing use cases, and highlighting success stories can motivate users to continue exploring and using the feature further.
4. Repeated Usage
The final phase, or better say, the final goal, is, of course, repeated usage. This occurs when users start to incorporate the feature into their regular workflows. Achieving this level of engagement indicates that the feature delivers consistent value. To foster repeated usage, gathering user feedback, addressing any pain points, and continuously improving the feature based on user needs are essential. Be wary that total overhaul of feature may actually discourage or upset existing frequent users, in such cases, it might be advisable to offer transition period when both old and new version of the feature (interface etc.) will be available. You can also try to improve repeated usage figures with digital adoption platform functions like welcome screens, tooltips, or modals - just make sure you do not overwhelm your users with “adoption spam” that stays in their way of actually doing things in your SaaS.
Improving Feature Adoption in SaaS and Web apps
Driving feature adoption in your digital product requires a strategic approach that combines effective communication, user education and guidance, and targeted engagement. Leveraging a user onboarding tool or digital adoption platform (DAP) like Product Fruits can significantly enhance your ability to improve adoption rates and other key metrics. Below are actionable tips, categorized into different approaches, to help you optimize your feature adoption strategy.
1. It all begins with user onboarding
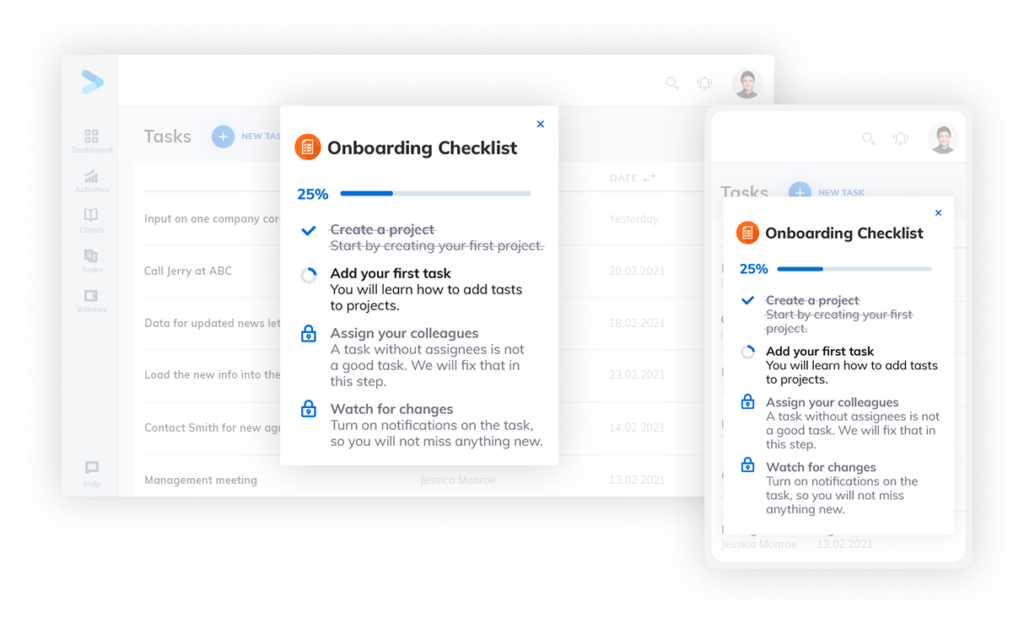
User onboarding typically covers steps from registration and first login to the first actual steps and things done in your SaaS or web app. The process should, therefore, include and cover some key features your users should try out when they first log in or early in their user journey. You can use features and functionalities of the onboarding tool or DAP, like a welcome tour and onboarding checklist with one or more feature tours. But be sure not to overwhelm new users - introduce them only to features they really need to know, and do so gradually.
2. Continue with In-App Communication
https://web-assets.productfruits.com/Website/PF_announcement_GIF02_kh2tyt.mp4
Effective in-app communication ensures more users are aware of newly introduced or underused features and understand their value. Digital adoption platforms make it easy to implement and manage these tools.
- Feature Announcements:
Use banners, pop-ups, or modals to announce new features as users log into the product—but again, do so without being annoying or obstructive.
Example: A banner highlighting "New Collaboration Features Now Available!" with a link to learn more. - News Section in Help Center:
Maintain a “What’s New” section where users can find details about recent updates and enhancements. This is a passive but accessible way for users to discover new features. - Tips for Success:
- Keep announcements brief and focused on user benefits.
- Include clear calls-to-action (CTAs) like “Try Now” or “Learn More.”
- Time notifications strategically, such as when users are likely to benefit from the feature (i.e., do not announce new features to users who have just registered and should focus on things like a welcome tour or onboarding checklist).
3. Use Feature Tours and In-App Walkthroughs
Interactive tutorials or walkthroughs are invaluable for more complex features. These tools, available on platforms like Product Fruits, guide users step-by-step, showing them how to use a feature and its benefits.
- Feature Tours:
Use guided tours that highlight key elements of the feature directly in the interface.
Example: A guided tour demonstrating how to set up and use a new analytics dashboard. - In-App Walkthroughs:
Provide clickable, context-sensitive instructions for complex workflows. Users can follow along at their own pace. - Tips for Success:
- Focus on showing value quickly—users should see the “aha moment” within minutes.
- Allow users to skip or revisit the tour as needed.
- Use tooltips, hotspots, or progress indicators to make the experience intuitive.
4. Target Communication to the Right Users
User onboarding or adoption platform segmentation allows precise targeting of feature tours and other functions.
Not every user needs to see every feature. Tailoring your messaging ensures the right audience engages with the right features.
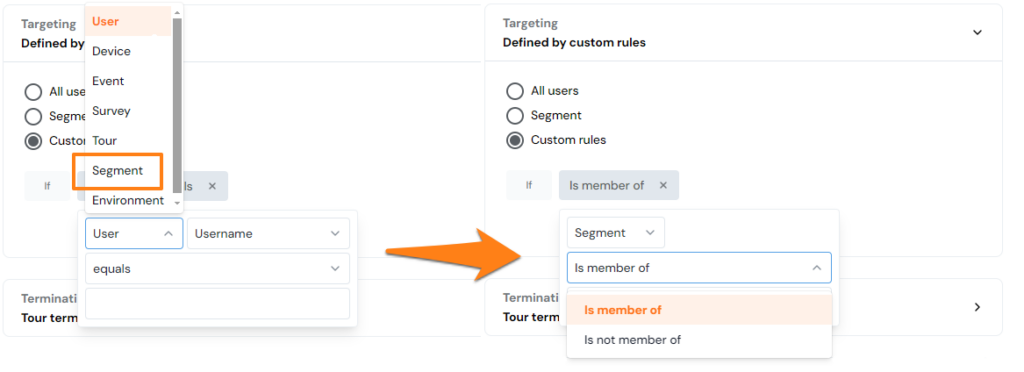
- User Segmentation:
Group users based on characteristics like role, subscription plan, or behavior.
Example: Show advanced analytics feature tours only to users who started a premium plan. - Behavioral Triggers:
Use actions (or inactions) to trigger communication.
Example: If a user hasn’t used a reporting tool in a month, send a nudge about the feature. - Personalized Content:
Include user-specific language and examples. Highlight how the feature solves pain points unique to their use case.
5. Continuously Optimize Through Feedback
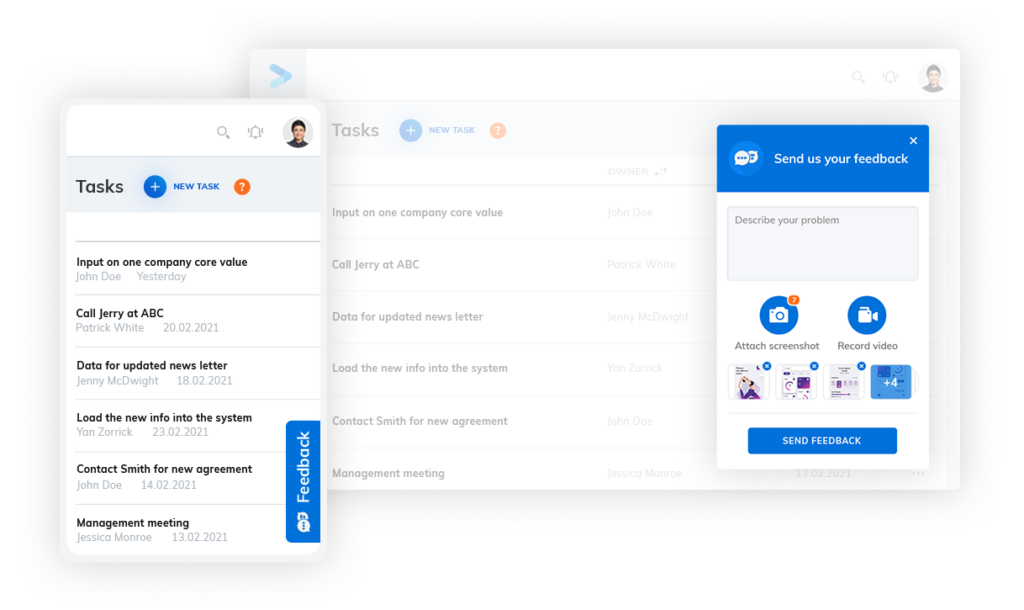
Product Fruits Feedback Widget.
Improving feature adoption isn’t a one-time effort—it’s an iterative process.
- Collect user feedback:
Use surveys, in-app prompts, or direct user interviews to understand why users do or don’t engage with certain features. - Iterate Based on Insights:
Refine your communication and onboarding strategies based on data and user feedback to increase the feature adoption rate.
6. Incorporate Value Reinforcement
Highlight the ongoing benefits of adopted features to ensure sustained usage.
- Celebrate Milestones:
Notify users when they achieve something with a feature, like completing their first workflow or achieving a productivity goal. - Provide Contextual Reminders:
Remind users of its benefits with in-app notifications or emails if a feature is underutilized.
Implementing these strategies using tools like Product Fruits can significantly improve SaaS businesses' feature adoption metrics. Combining in-app communication, targeted engagement, and ongoing optimization creates a seamless user experience, driving long-term product success. Try the Product Fruits now, and the first two weeks are free - on us!


Weekly newsletter
Get the latest releases, tips, articles, and exclusive interviews delivered to your inbox weekly—no spam!