What Is User Retention? Measurement & Improvement Strategies for 2025


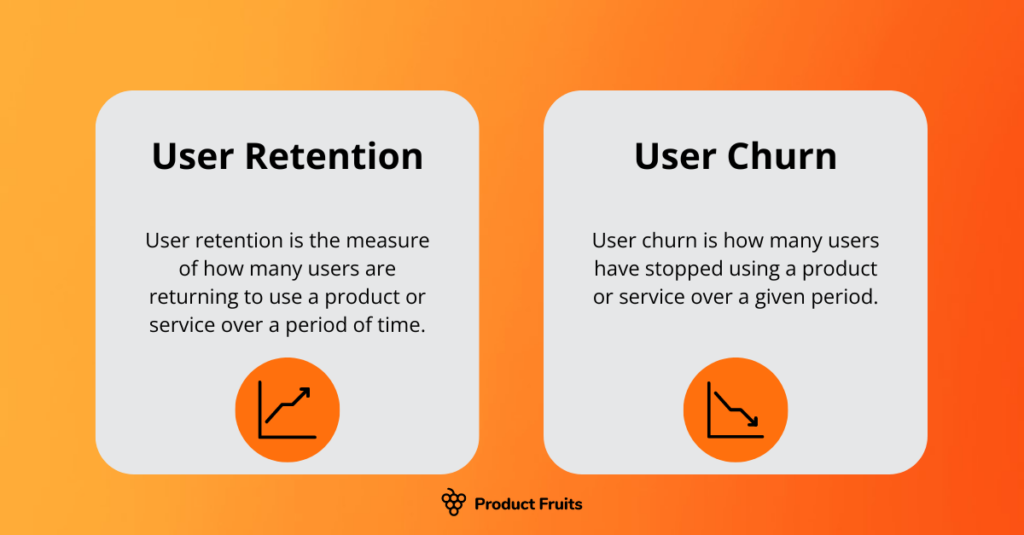
User retention is usually seen as a rate, showing the percentage of active customers from one time period who remain customers in the next. User Retention also refers to the steps a company takes to encourage continued use of a product and reduce the chances of churn.
When the median gross retention rate—the percentage of revenue from repeat customers—is about 90%, it proves that B2B SaaS companies rely heavily on keeping their customers satisfied. Their survival depends on strong customer retention.
It also costs five times more to acquire a new customer than to retain an existing one. This makes the stakes even higher for businesses trying to maintain long-term growth.
What is user retention?
User retention is the total number of users who interact with your product over a certain period. It is typically used to track B2C products, mobile apps, and freemium apps.
You can calculate user retention for any defined period. For example, you might track your retention rate monthly or quarterly, or select a different timeframe to analyze.
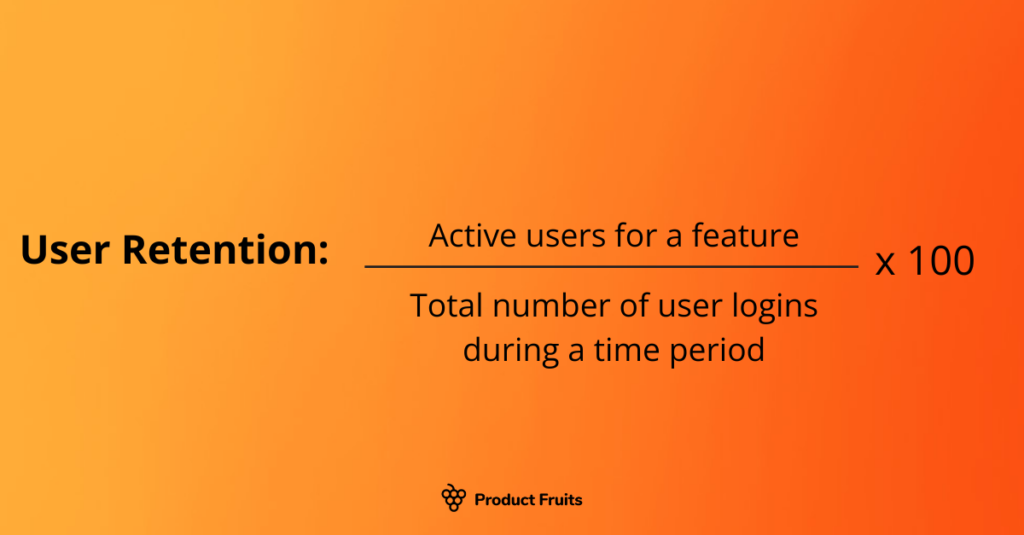
You can calculate user retention for your entire app or for specific features. If you are measuring overall product retention, track the number of logins over time.
For a more detailed view, focus on how many users interact with a specific feature within your chosen timeframe.
Pssst... Take a peek: 6 User Onboarding Metrics You Need to Keep An Eye On
User retention vs. customer retention
User retention measures how many individual users log in or interact with a product. This is a product team metric focused on usage. Customer retention, on the other hand, tracks overall paying accounts, making it a financial or customer success metric.
Customer retention reflects how well a company retains new customers and turns them into repeat buyers. It is often used in B2B products with long-term contracts instead of user retention.
Customer retention can reveal if a marketing product aligns with customer expectations. It also helps identify poor experiences and pain points in the customer lifecycle, such as bad onboarding or weak support.
What is the difference between User Churn & Retention
The Churn rate is the percentage of users who leave your product within a given period. It works as the opposite of user retention. Churn includes users who canceled their subscriptions, did not renew, or uninstalled your app.
A high churn rate means users don’t find enough value in your product. It also signals risk, as dissatisfied users may look for alternatives, allowing competitors to step in.
Why Is User Retention Important?
User retention plays a key role in every business, regardless of its size or industry. It measures how well a company maintains user engagement and satisfaction with its products or services over time.
Acquiring new users is more costly than keeping current ones because of marketing and advertising expenses. Businesses can reduce these costs by focusing on retention while maintaining steady revenue. Users who stay are more likely to make repeat purchases, increasing their lifetime value. Happy customers also spread the word, bringing in new users and boosting revenue.
A consistent positive user experience fosters brand loyalty, helping businesses build lasting relationships with customers. Loyal users tend to forgive minor mistakes, like delivery delays or small product issues, and remain supportive. They may also promote your brand to others through word-of-mouth recommendations.
Users who stay provide useful feedback about your product or service. This feedback can help companies identify improvements and adjust their offerings to better serve customers. Businesses that listen to users and act on feedback are more likely to create products that truly meet customer needs.
Customer retention increases customer loyalty, which comes with many benefits:
- Loyal customers often recommend products to family and friends. The more customers you keep, the more new customers you gain.
- Loyal customers are more likely to share useful product feedback because they are more invested in the product.
- Loyal customers tend to spend more, making them more valuable to your business.
How to Measure User Retention
Tracking user retention helps you understand how well your business keeps customers coming back. Here’s how to measure it effectively:
Choose Your Time Frame
Start by selecting a time-period for analysis. This could be days, weeks, months, or years, based on how often users interact with your product or service.
For mobile apps, you may track daily or weekly retention, while subscription services often focus on monthly or yearly retention.
Calculate Retention Rate
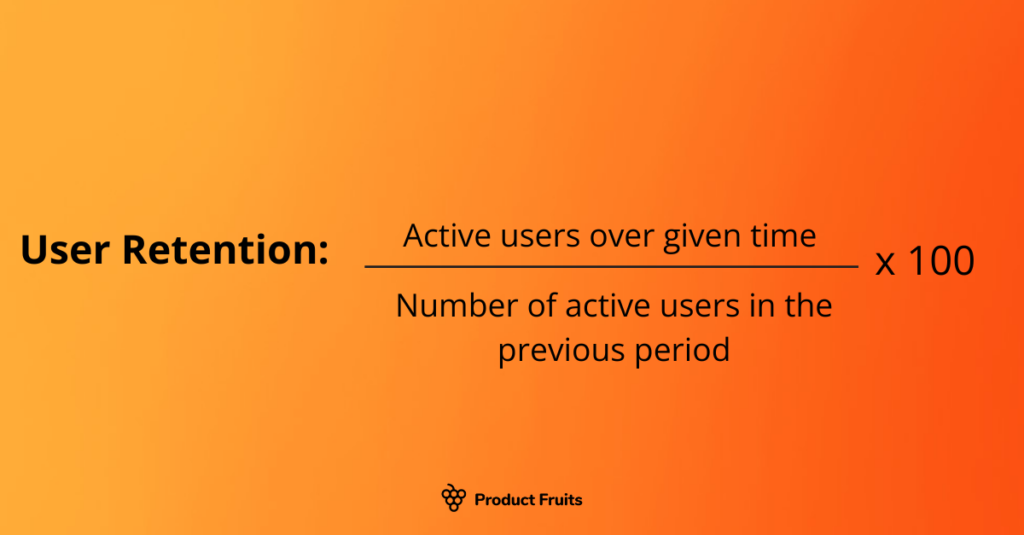
The retention rate shows the percentage of users who return to your product or service after their first visit or purchase within a set period.
To calculate retention, you need two numbers:
- Users at the start of the period
- Users still active at the end of the period
The formula is:
Retention Rate = (Users at the end ÷ Users at the start) × 100%
Track Retention with Cohort Analysis
Cohort analysis helps measure retention by grouping users based on their start date. This approach lets you track specific user groups over time and understand how product updates or marketing strategies impact different cohorts.
For example, you might analyze retention rates of users by comparing users who signed up before a major product update to those who joined after to see if the update improved retention rates.
Use Analytics Tools to Track Retention
Many analytics tools can simplify user retention measurement. Platforms like Google Analytics and FullSession offer built-in features to track retention rates and conduct cohort analysis.
These tools provide visual reports and insights, making it easier to analyze and understand retention trends.
What drives user retention?
- Onboarding: User retention begins with a smooth onboarding experience. New users should be able to complete essential product setup tasks, such as creating an account, without confusion. If there are key configuration steps, like integrations or inviting teammates, users should receive clear guidance to help them complete these actions quickly and effortlessly.
- Activation: After onboarding, users need to experience value quickly. Early wins help build momentum, reinforcing why they should continue using the product. When users see immediate benefits, they are more likely to return.
- Habit: The last step in driving user retention is establishing consistent usage habits. Identify triggers that encourage users to return and complete key tasks. For example, in an expense-processing app, users may develop a habit of taking photos of receipts to submit expenses. Aligning user behavior with the app’s natural usage frequency helps businesses refine their onboarding and activation strategies.
As an example, the team at Oranj noticed that retained customers had users who frequently visited the platform and successfully completed onboarding.
Using this insight, they analyzed product usage data to pinpoint where users dropped off during onboarding. By addressing these gaps, they increased onboarding completion rates and ultimately boosted user retention.
What Is User Churn?
User churn measures how many people stop using an app or product after their initial interaction. This includes users who no longer engage with the app or have uninstalled it from their devices.
If your app has a high churn rate, you may need to improve the user experience or marketing to keep users engaged. Otherwise, you could be overspending on user acquisition instead of focusing on retention.
What Is a Good User Retention Rate on Average?
There is no set universal standard for a "good" user retention rate, but generally, higher is better. Most apps have an average retention rate of 6% to 20% over eight weeks, which can serve as a benchmark for your industry.
Remember that retention rates vary by device. You may notice differences between Android and iOS users.
A good customer retention rate depends on your app investment and ROI relative to your business goals. If you have high acquisition rates but low repeat purchases or subscriptions, it’s a sign to improve customer retention. Fortunately, there are many ways to increase it.
Key User Retention Metrics You Should Track
Monitoring key metrics alongside user retention provides a more comprehensive view of your product or service performance. By analyzing various data points, you can uncover trends and patterns that might not be immediately obvious from retention rates alone.
For instance, while user retention may be improving, a decline in session length could indicate lower engagement levels. Such insights help identify what’s working and what needs adjustment, enabling you to optimize the user experience effectively.
Tracking key user retention metrics offers valuable insights into user behavior and the overall health of your business. Here’s one of the most critical metrics to monitor:
1. Churn Rate
Churn rate is the opposite of retention rate—it measures the percentage of users who stop using your service within a given period. By analyzing churn, you can determine how many users you're losing and investigate the underlying reasons, helping you take action to improve retention.
2. Tracking Daily (DAU) and Monthly Active Users (MAU)
These metrics track how many users engage with your product daily and monthly, respectively. A high DAU-to-MAU ratio indicates strong user engagement and regular retention, suggesting that customers find ongoing value in your product.
3. Average Revenue Per User (ARPU)
By measuring the average revenue each user generates, you can assess the financial effectiveness of your retention efforts. An increase in ARPU, along with improved retention, indicates that the users who stay are becoming more valuable over time.
4. Customer Retention through Repeat Purchases
For e-commerce platforms, the repeat purchase rate is essential. It tracks how frequently customers return to make additional purchases, serving as a clear measure of both customer loyalty and satisfaction.
Crucial Areas of the Customer Journey That Drive Retention
Over 70% of app users churn within the first three months, typically passing through three key phases: onboarding, activation, and habitual use. These stages are crucial barriers to user retention as they require users to take specific actions to move forward. To keep a high retention rate, it's essential to ensure that each phase provides a smooth and enjoyable product experience that encourages users to progress.
1. User Onboarding
User onboarding is a crucial phase where first-time users sign up and begin exploring your product. The primary goal of user onboarding is to familiarize new users with the product, introduce them to its features, and lead them to their “aha!” moment, allowing them to see the product’s value (also known as time-to-value).
A smooth, intuitive user onboarding experience helps users transition to the next phase quickly, while a complex or confusing process can lead to high drop-off and churn rates. User Onboarding is your chance to guide users toward key features, demonstrate the product's potential, and encourage regular use.
That’s why providing an exceptional SaaS customer onboarding experience is vital—ensuring users can easily access the information they need and feel confident using your product.
Your new user onboarding experience should:
- Guide users to their “aha!” moment.
- Minimize time-to-value.
- Offer in-app assistance to resolve technical setup and new user issues.
2. Activation
User activation is the key objective of the onboarding process, and it’s achieved when users fully understand the value your product offers. This typically happens during their “aha!” moment — when everything clicks, and they realize how your product can enhance their day-to-day tasks. The time it takes for users to reach this moment is referred to as time-to-value (TTV). Once activated, users tend to have a positive view of your product and are more likely to remain engaged.
Activation can be seen as an extended phase of onboarding. During this stage, users begin exploring more advanced features and gain deeper familiarity with the product, increasing their likelihood of long-term retention.
To help new users become advanced users, you can:
- Encourage them to explore underused or advanced features by offering in-app tutorials that highlight their value.
- Send usage reminders via email to nudge users into making the most of their subscriptions.
- Announce new features through pop-ups and email notifications.
- Share case studies, webinars, and other customer success stories through pop-ups and emails, showcasing how similar users or companies benefit from advanced features.
- Track user actions that indicate interest in expanding their use of the product.
- Encourage users to invite or refer others from their team to join the platform.
3. Habit Formation
In the third phase, users develop a routine around your product, making regular use a natural part of their day. Users in this stage come to rely on your product, and encouraging more users to reach this habit-forming phase leads to higher retention rates.
Power users have evolved into highly engaged, experienced users. They take full advantage of all the features your product offers and use it to solve various challenges. These users become brand advocates, publicly sharing their positive experiences and the value your product brings
To turn advanced users into power customers, you can:
- Gather their feedback to inform and shape your product roadmap.
- Arrange weekly 1-on-1 meetings to offer personalized training and in-depth product tutorials.
- Invite them to speak at your sponsored events or exclusive dinners.
- Encourage them to join private communities and roundtable discussions, allowing them to connect with and learn from other power users.
4. Session Duration
Session duration tracks how long users remain engaged with your platform during each visit. Longer sessions typically signal higher engagement, which often correlates with improved retention rates.
5. Customer Lifetime Value (CLTV)
CLTV estimates the total net profit generated throughout the entire relationship with a customer. Understanding this value helps you determine the appropriate balance between investing in user retention and acquiring new customers.
6. Net Promoter Score (NPS)
NPS gauges customer satisfaction and loyalty by asking how likely customers are to recommend your product or service. A high NPS often indicates strong user retention, as satisfied customers are more likely to remain loyal and advocate for your brand.
3 Key Best Practices for Improving Customer Retention
Achieving a high user retention rate requires delivering value while minimizing friction in the user experience. The key is to demonstrate your product’s value as quickly as possible.
Here are twelve best practices, strategies, and tips to help retain and upsell your customers:
Offer Contextual, Simple, In-App Guided Onboarding for New Users
The goal of user onboarding is to make users feel confident and knowledgeable about your product without overwhelming them. A clear, information-rich, and iterative onboarding process leaves a positive first impression, which is essential for retaining engaged users.
To ensure a successful onboarding experience, consider:
- Including in-app demos and tutorials.
- Using tooltips to explain product features.
- Creating interactive walkthroughs.
- Offering personalization options right from the start.
- Providing an in-app resource center to address common support questions.
Regularly analyze your user onboarding completion rates and iterate based on data to continuously improve the experience.
In-app onboarding empowers new customers and users with step-by-step tutorials, product tours, interactive walkthroughs, tooltips, pop-ups, and more—all directly within your app. This hands-on approach allows users to learn by doing, making the onboarding experience more practical and engaging.
Instead of relying on lengthy demos or external knowledge bases, in-app onboarding shows customers how to use your app as they navigate it. With real-time guidance, users can quickly understand your product’s value, leading to better retention.
In-app features like task lists, tooltips, product tours, and walkthroughs help users set up their accounts, perform complex actions, and explore core features. These tools are designed using a simple, no-code editor, making them easy to implement.
Regularly analyze and test user behaviors and product experiences using advanced analytics to optimize your onboarding. Collect valuable feedback through native surveys to understand customer sentiment, gauge the effectiveness of your onboarding, and identify areas for improvement. Use beacons, tooltips, and feature walkthroughs to encourage adoption of new features and enhance user engagement.
Levage Cohort Analysis to Understand Your App’s Value:
Cohort analysis is a data-driven approach that allows you to compare the behavior of users within different “cohorts” or user segments, such as acquisition date or demographics. By examining these cohorts, you can identify which features and user characteristics are linked to higher retention, enabling you to focus your efforts on what truly works.
You have flexibility in how you define your cohorts, but it’s important to segment users based on criteria that are essential to your product’s success. This type of analysis helps you draw valuable insights between user behavior and retention rates, guiding your product development strategy.
For example, if users who spend more time in your app are more likely to stay engaged, you should prioritize features that keep users active for longer. Similarly, if users who engage with a particular feature tend to stay longer, make sure your marketing and onboarding processes highlight that feature to drive retention.
Create a Simple, Intuitive UI
Users want a UI that clearly communicates benefits and is easy to navigate. If you’re seeing retention issues, it’s time to audit your UI to ensure it aligns with the needs of your specific audience.
Consider auditing these key UI elements:
- Ensure buttons and gestures are optimized for your target audience (for example, apps designed for children or the elderly may need larger buttons or simplified interactions).
- Highlight important features without overwhelming users with unnecessary elements.
- Organize your app so users can easily reach their desired destination with minimal effort.
- Ensure your app is responsive and fast—slow-loading apps will drive users away.
Product teams should map out user flows and create journey maps to understand how users navigate toward key goals.
If you're seeing a decline in user retention but aren't sure which UI element is to blame, try A/B testing. This involves creating multiple versions of specific features and showing them to different user segments. By analyzing the results, you can determine which UI features resonate with your audience and which ones may be negatively affecting retention.
Conclusion:
Good user retention is the result of a seamless onboarding process combined with a product that consistently meets user needs, encouraging them to return. High retention rates are driven by a platform that helps users achieve their goals, delivers value, and offers a smooth, educational experience. When users understand how to navigate the platform, recognize its value, and engage with its features, they’re more likely to stay.
To achieve this, you need a comprehensive onboarding ecosystem to deliver that value. Product Fruits provides the tools, workflows, and resources to enhance user retention.
👉 Try Product Fruits for free today and discover how it can make a difference! 👈
No coding required—simply add a customizable, invisible layer to your platform and start converting users from day one.
Reach out to our user onboarding specialists to learn more.


Weekly newsletter
Get the latest releases, tips, articles, and exclusive interviews delivered to your inbox weekly—no spam!