As a product manager or owner, are you spending most of your time going through user adoption or customer adoption metrics, digging into usage statistics, churn rates, and other user-focused data? Do these really tell you all you need to know about the performance of your product?
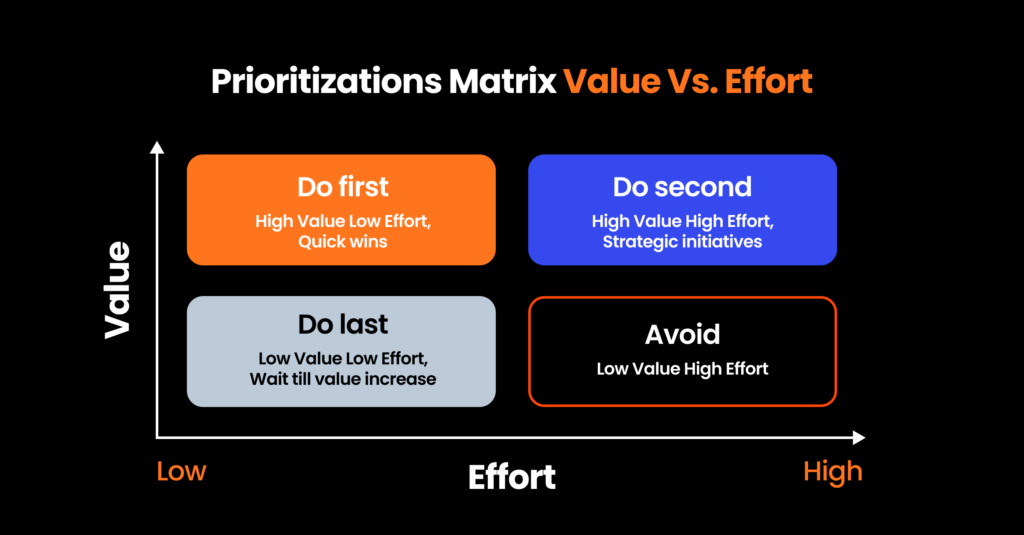
While these insights are incredibly valuable, you might sometimes want to take another perspective: analyzing adoption metrics and KPIs from the product’s standpoint. By taking this product-centric view—looking beyond just who is using your application to precisely how they’re using (or not using) it—you can uncover the most substantial aspects of your digital product and the areas most needing improvement. These can help you with one of the PM’s ultimate questions: What should you prioritize as best described by the classic prioritization matrix used by many product managers and leaders?

The shift in perspective empowers you and your product or development team to approach product adoption metrics in a way that highlights precisely which features drive engagement and satisfaction—and which might be holding your SaaS solution back. You’ll be better equipped to pinpoint friction points, prioritize feature enhancements, and deliver a more streamlined experience (which will also make the CSM team happy).
So, this time, we’ll explore adoption metrics to track from a product perspective. This does not mean that you (or your CSM colleagues) should forget about user-oriented metrics like CLV (customer lifetime value), TTV (Time to Value), MAU (monthly active users), CSAT (customer satisfaction), DAU (daily active users), user activation rate, CSAT (customer satisfaction score)… And other KPIs aimed at how users adopt your SaaS. Or about user behavior, new users, user engagement, and, in general, how many users are satisfied with your product. We have even covered many of them, as well as metrics explicitly related to the onboarding process or DAP (digital adoption platform) functions in our previous blog articles:
A digital platform like Product Fruits is the best tool to improve product adoption. You can try it out for free (two weeks are on us) and start experimenting with onboarding and adoption flows, in-app communication, an integrated help center, and much more!
Before diving into specific adoption metrics examples, it’s worth emphasizing why you should track product adoption metrics and KPIs:
Feature Usage Rate measures how frequently a specific feature is used relative to the rest of the product. For example, if your product offers five core features, you can compare how often each is activated during a given period.
From a product adoption metrics standpoint, a feature rarely used might indicate poor discoverability, lack of user awareness, or a mismatch with user needs. There are a number of things you can do about it. You can make the feature more visible – either in the product itself or with the help of adoption platform functions like announcements or feature tours. Alternatively, you may decide to retire a feature or revise it before investing more time and effort into it. Conversely, high usage signals that the feature is critical to user adoption—and might justify further investment or enhancement.

Monitoring this product adoption metric helps product managers identify which features contribute most to the software adoption metrics of the entire application and where the product or in-app guidance might be needed to boost usage.
Depth of Feature Usage looks at how many different features a user or account typically interacts with within one session (or over a specific timeframe). Instead of focusing on a single feature, this metric shows whether customers are exploring a broad swath of your platform.
A higher depth typically translates to a higher product adoption rate. A user who only uses one feature may not have a fully realized product experience, which increases the risk of churn. Conversely, engaging with multiple features often signals stronger customer adoption metrics.

Depth of feature usage tells you if customers see value across a range of capabilities. Suppose the product has 10 features, but only two are utilized on average. In that case, it’s a red flag that you may need an onboarding flow (like a walkthrough powered by our DAP) to showcase key capabilities and increase the app adoption rate. You can also start a discussion about repositioning your product and develop the most used features further to gain a competitive advantage through depth rather than breadth.
This is the percentage of times a user starts using (or sets up) a feature but doesn’t complete the workflow. Examples might include partially filled forms, incomplete checkout sequences, or an abandoned configuration wizard.
An elevated abandonment rate erodes your overall adoption rate because users fail to realize the feature’s full value. High abandonment often indicates friction or confusion in the user flow.

Understanding fully the product adoption requires insight into where users get stuck. Abandoned features are quite different from underused or unused features. It means users want or would like to use it but struggle to finish their task. You should always investigate more to see if this can be readily fixed with some sort of in-app hint, better quality of in-app self-help or support, or if a technical issue with your product needs fixing. In every case, reducing friction is key to boosting user adoption and creating a more seamless experience in the product.
Usage Frequency measures how often users return to your product over a defined period—daily, weekly, or monthly. The more frequently the usage is used, the stronger the SaaS adoption metrics typically become.
Even if a customer has a broad adoption rate of your features, the product might not be core to their workflow if they don’t return often. Low frequency can indicate misalignment with user needs or high friction.
Choose the best interval (daily/weekly/monthly) depending on your product. You might look at the number of days in a month a user is active (for monthly) or the number of unique active users in a week (for weekly usage).

Metrics like product usage frequency are directly tied to retention and monetization. They may also vary seasonally or by customer industry; if you find such variance, you may want to consider making products relevant outside of these “seasons” or look for ways to use this strong seasonality for marketing, sales, or upsell purposes.
Product or Average Session Duration refers to how long a user spends on the product per session. It can be measured in minutes or seconds.
A longer session might imply deeper engagement or that your platform demands more time to accomplish tasks. On the other hand, very short sessions could mean high efficiency—or it could reflect that customers are not exploring the product enough.

Higher session durations for specific product types, especially B2B SaaS solutions, may indicate that users perform complex tasks or engage deeply. If your product is meant to be quick and streamlined, shorter sessions might indicate a good product adoption rate.
A digital adoption platform like Product Fruits is the best tool for improving product adoption. You can try it out for free (two weeks are on us) and start experimenting with onboarding and adoption flows, in-app communication, an integrated help center, and much more!
Understanding these core product adoption metrics—Feature Usage Rate, Depth of Feature Usage, Feature Abandonment Rate, Usage Frequency, and Average Session Duration — provides insights into product performance and adoption. By monitoring them regularly, product managers can:
When you combine these metrics with qualitative feedback—like customer interviews or user testing—your team can continuously refine the product to boost saas adoption metrics. Ultimately, these product adoption KPIs help teams make more informed roadmap decisions and ensure that the product consistently delivers value, reinforcing positive adoption rate trends.